9 dicembre forconi: 10/20/18

sabato 20 ottobre 2018

FERROVIE DELLO STATO SI PREPARA A RILEVARE IL 100% DI ALITALIA


LO SCHEMA DELL'OPERAZIONE PREVEDE CHE UN'OFFERTA VINCOLANTE ENTRO FINE MESE E IN SEGUITO L’ENTRATA DEL MEF E DI UN PARTNER INDUSTRIALE 

FS E I SUOI CONSULENTI VOGLIONO VEDERCI CHIARO PER EVITARE DI FINIRE SOTTO LA LENTE DELL'ANTITRUST PER UN POSSIBILE MONOPOLIO SULLA ROMA-MILANO…

Rosario Dimito per “il Messaggero”

EMBRAER E-175 ALITALIAEMBRAER E-175 ALITALIA
Piano Alitalia in due tempi. Prima Fs fa tutto da solo per rispettare i tempi, le promesse di Luigi Di Maio, le esigenze di verifica della Commissione Ue, poi si formerà la cordata con il Mef e il partner industriale. Questo il percorso delineato dal governo per contemperare tutte le esigenze.

All' interno di questo quadro, si è sviluppata la riunione-fiume dalla mattina a metà pomeriggio, di mercoledì 17, a Roma, presso lo studio Gianni Origoni Grippo Cappelli & Partners, advisor legale dei commissari, rappresentato da Roberto Cappelli.

toninelliTONINELLI
Presenti: il top management di Fs guidato da Roberto Mannozzi, capo del bilancio (assente l'ad Gianfranco Battisti), i commissari Luigi Gubitosi, Enrico Laghi, Stefano Paleari, affiancati dai banchieri di Rothschild, da Andrea Giorgianni di Mediobanca, ancora senza un mandato formale, e dai legali dello studio Cleary Gottlieb (Giuseppe Scassellati e Mario Siragusa) per conto di Ferrovie. La riunione è avvenuta su più tavoli per approfondire gli aspetti tecnico-contrattuali, procedurali e finanziari.

ferrovie dello statoFERROVIE DELLO STATO


Il confronto che da lunedì 22 proseguirà senza soste, è servito per consentire alla società pubblica dell' Alta velocità di entrare in data room e avviare la due diligence. E soprattutto, nonostante manchino meno di due settimane alla scadenza del 31 ottobre fissata dalla procedura per le offerte vincolanti, rendersi conto del percorso.

Uno dei punti aperti e centrali riguarda la parte economica: se cioè nell' offerta binding, Fs dovrà mettere un prezzo e ove lo mettesse, se costituisce impegno. Altro aspetto è la modalità per far entrare in cordata Mef e il partner nel rispetto del bando di gara. Altro aspetto ancora: il prestito ponte.

LE CONDIZIONI
Sarà Fs, salvo improbabili colpi di scena, a fare l'offerta vincolante per acquisire il 100% di Alitalia. Del resto l' ha fatto intendere Danilo Toninelli qualche giorno fa. «Su Alitalia penso che entro la fine di ottobre arriveranno buone notizie a partire da Fs», ha detto il ministro delle Infrastrutture e Trasporti giorni fa. «Il tavolo è sempre aperto e lo sta gestendo il ministro Di Maio» che ha assunto la regia delle manovre.
giovanni triaGIOVANNI TRIA

Lo schema dell'operazione è delineato, dovranno essere definiti nei prossimi giorni i dettagli, a cominciare dalla valutazione che è un particolare non da poco anche perché si incrocia con il prestito-ponte di 900 milioni in scadenza il 15 dicembre, sul quale l'Antitrust europeo tiene il faro acceso. Di Maio, quando ha indicato una settimana fa la rotta, ha fatto riferimento a una Newco con Fs, Mef e un partner industriale e una dotazione di 1,5-2 miliardi.

di maio salviniDI MAIO SALVINI


Questa dotazione non significa, però equity, bensì risorse per il rilancio. Fs sarebbe pronta a intervenire ma non a qualunque costo e, anzi l'altro giorno, i manager avrebbero fatto intendere che il prezzo va negoziato tenendo conto del piano industriale.

«L'ingresso di Ferrovie permetterebbe di lavorare al biglietto unico treno-aereo», ha detto il premier Giuseppe Conte. Ma su questo Fs e i suoi consulenti vogliono vederci chiaro per evitare di finire sotto la lente dell'Antitrust per un possibile monopolio sulla Roma-Milano. Fs vuole potersi esprimere sul management.

In una fase 2 interverranno gli altri attori, dal Mef, tirato dentro da Di Maio, a dispetto del ministro Tria che, come è noto, sul punto è più prudente. Ma il Tesoro, ove Tria si convincesse, difficilmente metterà soldi freschi visto il clima ostile in Europa.

Fonte: qui

Fund Manager: Financial Collapse Is Not A Question Of “If” But A Question Of “When”

Dave Kranzler explains why the coming economic and financial crisis will be much worse than what hit in 2008…
“’DON’T PANIC!!!!’ Just 6.9% off of the most offensive valuation extreme in history.” – Tweet from John Hussman, Hussman Funds
The above quote from John Hussman was a shot at the financial media, which was freaking out over the sell-off in the stock market on Wednesday and Thursday last week. As stock bubbles become more irrational, the rationalizations concocted to explain why stocks are still cheap and can go higher become more outrageous. The financial media was devised to function as a “credible” conduit for Wall Street’s deceitful, if not often fraudulent, sales-pitch.
Perhaps the biggest fraud in the last 10 years perpetrated on investors was the Dodd-Frank financial “reform” legislation. The Dodd-Frank Act was promoted by the Obama Government as legislation that would protect the public from the risky and often fraudulent business practices of the big financial institutions – primarily the Too Big To Fail Banks. It was supposed to prevent another 2008 financial crisis (de facto financial collapse).
However, in effect, the Act made it easier for big banks to disguise or hide their predatory business operations. Ten years later it is glaringly apparent to anyone who bothers to study the facts, that Dodd-frank has been nothing of short of a catastrophic failure. Debt, and especially risky debt, is at record levels at every level of the economic system (Government, corporate, individual). OTC derivatives are at higher levels than 2008. This is without adjusting for accounting changes that enabled banks to understate their derivatives risk exposure. The stock market bubble is the most extreme in history by most measures and housing prices as a ratio to household income are at an all-time record level.
A lot of skeletons in the closet suddenly pop out of “hiding” when the stock market has a week like this past week. An article published by Bloomberg titled, “A $1 trillion Powder Keg Threatens the Corporate Bond Market” highlights the fact that corporate America took advantage of the Fed’s money printing to issue a record amount of debt. Over the last couple of years, the credit quality of this debt has deteriorated. More than 50% of the “investment grade” debt is rated at the lowest level of investment grade (Moody’s Baa3/S&P BBB-).
However, the ratings tell only half the story. Just like the last time around, the credit rating agencies have been over-rating much of this debt. In other words, a growing portion of the debt that is judged investment grade by the ratings agencies likely would have been given junk bond ratings 20 years ago. In fact, FTI Consulting (a global business advisory firm) concluded based on its research that corporate credit quality as measured by ratings distribution is far weaker than at the previous cycle peaks in 2000 and 2007. FTI goes as far as to assert, “it isn’t even close.”
I’ll note that FTI’s work is based using corporate credit ratings as given. However, because credit ratings agencies once again have become scandalously lenient in assigning ratings, there are consequences from relying on the judgment of those who are getting paid by the same companies they rate. In reality, the overall credit quality of corporate debt is likely even worse than FTI has determined.
The debt “skeleton” is a scary one. But even worse is the derivatives “skeleton.” This one not only hides in the closet but, thanks to regulatory “reform,” it’s been stashed in the attic above the closet. An article appeared in the Asia Times a few days ago titled, “Has The Derivatives Volcano Already Begun To Erupt?” I doubt this one will be reprinted by the Wall Street Journal or Barron’s. This article goes into the details about the imminent risk of foreign exchange derivatives to the global financial system. There’s a notional amount of $90 trillion in FX derivatives outstanding, which is up from $60 trillion in 2010.
Many of you have heard about the growing dollar “shortage” in Europe and Japan. Foreign entities issue dollar-denominated debt but transact in local currency. FX derivatives enable these entities to swap local currency for dollars with banks. However, these banks have to borrow the dollars. European banks are now running out of capacity to borrow dollars, a natural economic consequence of the reckless financial risks that these banks have taken, as enabled by the Central Bank money printing.
As it becomes more difficult for European and Japanese banks to borrow dollars, it drives up the cost to hedge local currency/dollar swaps. Compounding this, U.S. banks with exposure to the European banks are required to put up more reserves against their exposure, which in turn acts to tighten credit availability.  It’s a vicious self-perpetuating circle that is more than partially responsible for driving 10yr and 30yr Treasury bond yields higher recently.  Perhaps this explains why the direction of the Dow/SPX and the 10-yr Treasury have been moving in correlation for the past few weeks rather than inversely.
But it’s not just FX derivatives. There’s been $10’s of trillions on credit default swaps underwritten in the last 8 years. The swaps are based on the value of debt securities. For instance, Tesla bonds or home mortgage securities. As the economy deteriorates, the ability of debtors to service their debt becomes compromised and the market value of the debt declines. As delinquencies turn into defaults, credit default swaps are exercised. If the counter-party is unable to pay (AIG/Goldman in 2008), the credit default swap blows up.
And thus the fuse on the global derivatives bomb is lit. The global web of derivatives is extremely fragile and highly dependent on the value of the assets and securities used as collateral. As the asset values decline, more collateral is required (a “collateral call”). As defaults by those required to post more collateral occur, the fuses that have been lit begin to hit gunpowder. This is how the 2008 financial crisis was ignited.
In fact, given the financial turmoil in Italy, India and several other important emerging market countries, I find it hard to believe that we have not seen evidence yet of FX derivative accidents connected to those situations. My best guess is that the Central Banks have been able to diffuse derivative problems thus-far. However, the drop in the stock market on Wednesday surely must have triggered some equity-related derivatives mishaps. At some point, the derivative fires will become too large s they  ignite from unforeseen sources – i.e.the derivatives skeletons come down from hiding in the attic – and that’s when the real fun begins, at least if you are short the market.
I would suggest that the anticipation of an unavoidable derivatives-driven crisis is the reason high-profile market realists like Jim Rogers and Peter Schiff have recently issued warnings that the coming economic and financial crisis will be much worse than what hit in 2008.

RATING: il downgrade Italia avrà effetti a valanga sulle banche italiane

Nel post di prima abbiamo parlato della grande sfida che vede di fronte il governo italiano, le agenzie di rating e Unione Europea.
All’interno di questa sfida, come vi ho detto, ci sono quelli che ne pagheranno le conseguenze. In primi i cittadini. Ma non possiamo dimenticare chi invece sta “a metà”, ovvero le banche. Che ne sarà delle banche?
Beh, ovvio. Ce lo dice Fitch…
(…) Fitch avverte che un eventuale declassamento del rating dell’Italia (che nel suo caso verrà eventualmente deciso solo a inizio 2019) avrebbe con ogni probabilità ricadute immediate sui rating delle sei banche che ha messo in outlook negativo, quando a fine agosto ha abbassato l’outlook sul Paese a tripla B dopo la formazione della nuova coalizione di governo e le prospettive di ulteriore allentamento fiscale. Si tratta di Bnl (BBB+), Credem , Intesa Sanpaolo , Mediobanca e Unicredit (tutte tripla B) e Unipol Banca (BB+). Un declassamento del Paese, dice ancora l’agenzia, con le banche molto esposte sui titoli di Stato, renderebbe più tese le condizioni finanziarie, più impegnativi i costi di finanziamento e finirebbe per erodere la redditività. (…) [Source]
Gli effetti collaterali. Ma qualcuno al Governo ha pensato agli effetti collaterali e a come questi si ribalteranno sulla popolazione e sul tessuto economico? Temo di no.
Intanto curioso il fatto che il CDS dell’Italia resta sempre sopra a quello delle banche italiane più importanti. Quindi il mercato oggi vede le stesse più affidabili del rischio governativo Italia, malgrado il fatto che la maggior parte delle banche italiane ha ancora una significativa esposizione al debito sovrano”.
Le ultime news mi danno possibili gli aggiornamenti dei giudizi sull’Italia da parte di S&P il venerdì 26 ottobre e di Moody’s verso il 31 ottobre.

CDS a confronto: Italy vs banks

Fonte: qui

Stranieri ed italiani in fuga dai titoli di Stato e dall'Italia


Segno meno da aprile in poi per gli acquisti di titoli di Stato italiani da parte degli investitori stranieri. Dalla formazione dell'esecutivo ad agosto, secondo quanto emerge dal bollettino economico di Bankitalia, il portafoglio di titolo di Stato in mano estera è sceso di 66 miliardi. Nel periodo tra aprile 2017 e aprile 2018, invece, il saldo degli acquisti di Bot e Btp da parte di investitori stranieri ha fatto segnare un segno positivo per 62 miliardi di euro. Nel solo periodo gennaio-aprile 2018, gli acquisti sono stati positivi per 42 miliardi. Con l'incertezza post voto e con la travagliata nascita dell'esecutivo Conte, invece, c'è; stato un deflusso pressoché continuo: a maggio il saldo ha segnato un calo di 25 miliardi di euro e a giugno è stato ancora maggiore, pari a 33 miliardi. Dopo la piccola ripresa di luglio (+9 miliardi), ad agosto sono stati venduti dagli investitori esteri altri 17 miliardi di titoli. Inversione di marcia. Segno meno da aprile in poi per gli acquisti di titoli di Stato italiani da parte degli investitori stranieri. Dalla formazione dell'esecutivo ad agosto, secondo quanto emerge dal bollettino economico di Bankitalia, il portafoglio di titolo di Stato in mano estera è sceso di 66 miliardi. Nel periodo tra aprile 2017 e aprile 2018, invece, il saldo degli acquisti di Bot e Btp da parte di investitori stranieri ha fatto segnare un segno positivo per 62 miliardi di euro. 

Nel solo periodo gennaio-aprile 2018, gli acquisti sono stati positivi per 42 miliardi. Con l'incertezza post voto e con la travagliata nascita dell'esecutivo Conte, invece, c'è stato un deflusso pressoché continuo: a maggio il saldo ha segnato un calo di 25 miliardi di euro e a giugno è stato ancora maggiore, pari a 33 miliardi. 

Dopo la piccola ripresa di luglio (+9 miliardi), ad agosto sono stati venduti dagli investitori esteri altri 17 miliardi di titoli.   Sui mercati finanziari italiani è rimasta elevata la volatilità che ha riflesso, oltre agli andamenti internazionali, l'incertezza degli investitori sull'orientamento delle politiche economiche. Nelle ultime settimane sono riemerse tensioni sul mercato dei titoli di Stato, che si sono estese anche ad altri comparti. I premi per il rischio sui titoli obbligazionari sovrani e bancari restano su livelli molto più elevati rispetto ai valori di inizio anno. I rendimenti dei titoli di Stato sono aumentati in misura marcata anche sulle scadenze più brevi, influenzati soprattutto dall'incertezza circa le politiche economiche e finanziarie. 

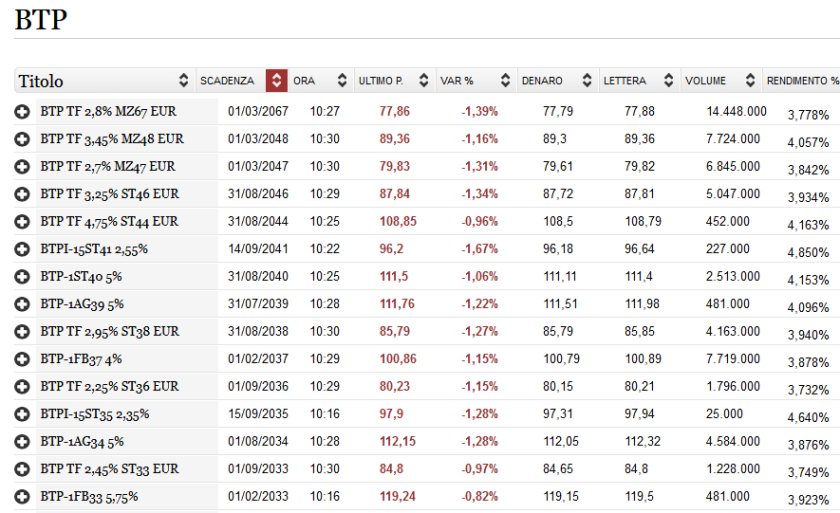
Sulla scadenza decennale, proseguono da via Nazionale, tali rendimenti si collocano a metà ottobre al 3,58%, circa 90 punti base in più rispetto alla fine di giugno. Il premio per il rischio sovrano, misurato dal differenziale tra i rendimenti dei titoli di Stato italiani e tedeschi, è aumentato nello stesso periodo di 70 punti base, portandosi a metà ottobre a oltre 300 punti base. 

Tra i fattori che possono concorrere a determinare il livello dello spread - spiega la Banca d'Italia nel bollettino - è rimasta su valori elevati, seppure inferiori ai livelli massimi registrati tra la fine di maggio e i primi di giugno, la differenza tra il premio sui credit default swap (Cds) dei titoli sovrani italiani stipulati dopo il 2014, che offrono protezione anche da una ridenominazione dei titoli in una valuta differente, e quello sui Cds stipulati precedentemente, che invece non offrono tale forma di protezione; questo differenziale è interpretato dagli analisti economici come una misura delle percezioni relative al rischio di ridenominazione del debito italiano, spiega ancora il bollettino. 

Sui mercati finanziari italiani è rimasta elevata la volatilità che ha riflesso, oltre agli andamenti internazionali, l'incertezza degli investitori sull'orientamento delle politiche economiche. Nelle ultime settimane sono riemerse tensioni sul mercato dei titoli di Stato, che si sono estese anche ad altri comparti. I premi per il rischio sui titoli obbligazionari sovrani e bancari restano su livelli molto più elevati rispetto ai valori di inizio anno. I rendimenti dei titoli di Stato "sono aumentati in misura marcata anche sulle scadenze più brevi, influenzati soprattutto dall'incertezza circa le politiche economiche e finanziarie". Sulla scadenza decennale, proseguono da via Nazionale, tali rendimenti si collocano a metà ottobre al 3,58%, circa 90 punti base in più rispetto alla fine di giugno. Il premio per il rischio sovrano, misurato dal differenziale tra i rendimenti dei titoli di Stato italiani e tedeschi, è aumentato nello stesso periodo di 70 punti base, portandosi a metà ottobre a oltre 300 punti base. 

Fonte: qui

Borse europee che scricchiolano. Usa e Cina attraggono i capitali.
2018-10-19__Borse__001Una cosa sono ciò che propalano i media ed un’altra del tutto differente ciò che sta succedendo.2018-10-19__Borse__002Molto semplicemente, i capitali stanno disinvestendo dall’Europa e si stanno indirizzando sia negli Stati Uniti sia in Cina, alla ricerca di collocamenti più sicuri e maggiormente redditizi.
2018-10-19__Borse__003

Né si pensi che questo fenomeno sia terminato.

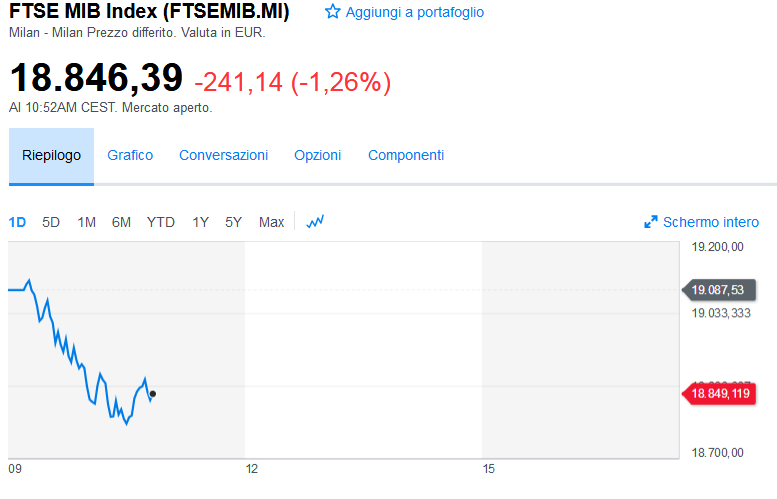
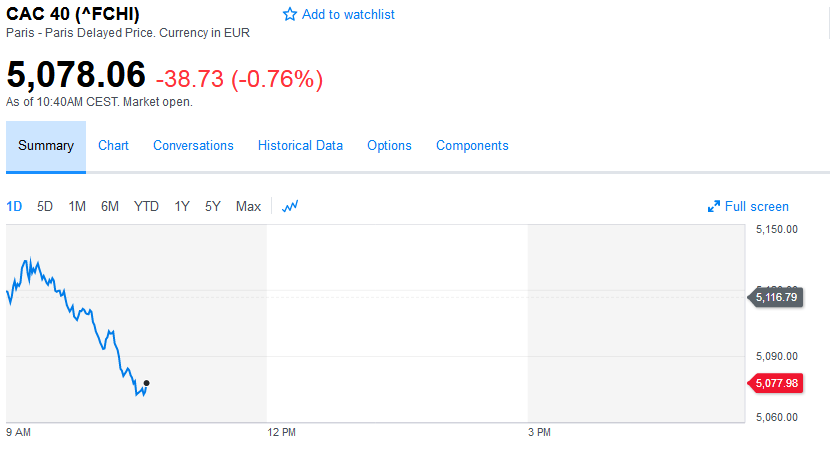
Il 23 gennaio il Ftse Mib valeva 23,890 ed ora 18,835: un discesa del -21.16%.
2018-10-19__Borse__004La Germania sta avviandosi al caos politico e tutta l’Unione Europea è politicamente lacerata: non è un clima atto a richiamare capitali.

2018-10-19__Borse__005

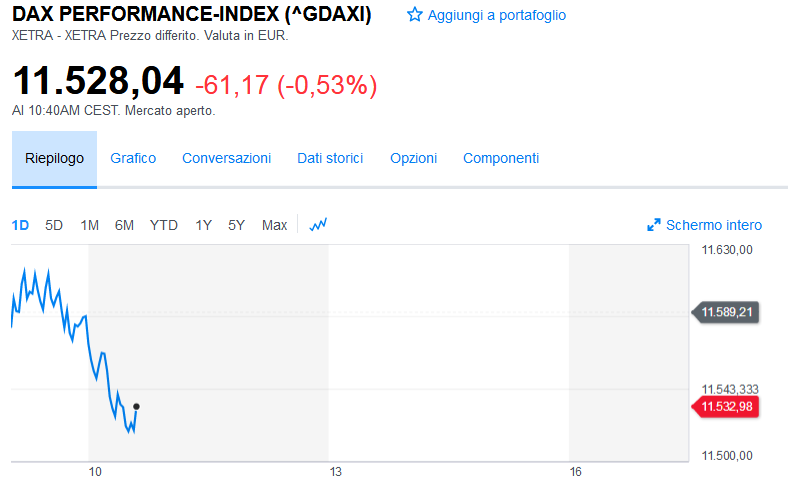
Dax a 11,528, -0.53%. 

 Bloomberg. 2018-10-19. Europe Stocks Fall After China Rebound; Oil Gains: Markets Wrap

– Dollar Index steady near its strongest since mid-2017

– Italian government debt extend losses; Treasuries steady

*

European stocks struggled as investors weighed the outlook for corporate profits against the positive mood from China, where equities rebounded from a four-year low as financial regulators vowed to keep risks under control. Treasuries and the dollar were steady.

The Stoxx Europe 600 Index edged lower, with carmakers declining after Michelin warned of declining sales. Futures on the Dow, S&P and Nasdaq pointed to a higher U.S. open. The MSCI Asia Pacific Index slipped as declines in Tokyo, Mumbai and Taiwan countered gains in Shanghai and Hong Kong, with Chinese officials pledging support for the country’s stock markets. Italian debt fell as leaders of European Union nations warned the populist government in Rome its budget won’t fly. The pound fluctuated as Brexit negotiations inched forward.

China’s efforts to stem a selloff came as growth data for the world’s second biggest economy registered slightly below expectations, as the trade showdown with the U.S. starts to bite. A slew of other risks cloud the outlook, and investors are wading through company results as they grapple with Brexit, Italy’s confrontation with the EU over its budget and worsening American-Saudi relations over the disappearance of journalist Jamal Khashoggi.

Elsewhere, oil recovered from near the lowest level in almost a month after expanding American stockpiles overshadowed tensions between the U.S. and Saudi Arabia over the disappearance of a prominent kingdom critic.

Terminal readers can read more in our Markets Live blog.

These are the main moves in markets.

Fonte: qui

Fuga di capitali dall'Italia: segnali preoccupanti dal confine con la Svizzera


Fuga di capitali dall'Italia: segnali preoccupanti dal confine con la Svizzera

La crisi della Grecia inizia a spaventare l’Italia, e i più ricchi corrono ai ripari spostando i capitali in Svizzera

Una situazione, quella italiana, che inizia a richiamare alla memoria il brutto periodo attraversato dalla Grecia L’indebolimento dell’euro nei confronti del franco svizzero, e il continuo sali-scendi dei rendimenti delle obbligazioni italiane, stanno spingendo alcuni risparmiatori a correre ai ripari. I risparmiatori in questione sono quelli appartenenti alla classe medio-alta del Paese, che in vista del progressivo deteriorarsi delle relazioni tra Italia e UE, in previsione quindi delle conseguenze che ciò potrebbe comportare sulle banche e sui mercati dei capitali, stanno provvedendo a convertire i risparmi in euro in franchi svizzeri.

Come accennato, tutto ciò ricorda un po’ quel che avvenne in Grecia in un passato ancora troppo vicino, con la corsa agli sportelli bancomat

In quell’occasione i cittadini greci rischiavano di trovare file senza fine, o un limite di 50€ a prelievo, e anche in Italia oggi, sembrano iniziare a serpeggiare timori simili per il prossimo futuro.

Ad informarsi in merito a come trasferire i propri fondi su conti svizzeri sarebbero soprattutto quelli che “se la passano meglio”, cioè coloro che hanno patrimoni tra i 5 e i 10 milioni di euro. 

Gli altri, i cosiddetti super-ricchi, si sarebbero già organizzati da tempo, correndo ai ripari molto prima che la situazione iniziasse a scottare.Ma inizia a muoversi anche chi ha patrimoni compresi tra i 200mila e i 300mila euro, con l’intenzione di aprire conti a Lugano o a Chiasso oltre il confine in Ticino. Si è disposti a pagare eventuali bolli e tasse, pur di spostare i propri risparmi dove potrebbero essere più al sicuro.

Massimo Gionso, consigliere delegato di Cfo Sim ha precisato che quel che stanno facendo questi Italiani è del tutto legale. In Italia infatti non esistono, perlomeno fino a questo momento, leggi volte a limitare il flusso di denaro fuori dal Paese.

Fonte: qui

"These Are All Starting To Crack": Bank of America Spots 4 Bearish Anomalies

In the latest Flow Show report from BofA's Michael Harnett, the Chief Investment Strategist notes that, as expected, there was a major flow capitulation during the last week following the worst rout in the market since February. To wit, there was a massive $15.8BN outflow from equities, coupled with $8.1BN out of bonds.
Broken down by category, there were big outflows from US stocks ($14.8BN), mutual equity funds ($15.5bn) and, of course, Europe where some $4.8Bn fled following the latest Italian turmoil. Credit was not spared either with a "huge" $6.2 billion in IG bond redemptions, one week after what was already record outflow from investment grade.
Meanwhile, the recent reversal in investment sentiment continues with $11Bn in outflows from financials over the past 7 months, after $32bn in inflows since 1/17; in just the past 4 weeks there have been $2Bn in tech redemptions after $42Bn in inflows since January.
Offsetting the flight from risk, BofA highlights an institutional "dash to cash" manifesting in the 3rd heaviest day of volume ever in Eurodollar futures (ED1), while Hartnett also notes that private clients have been aggressively turning to T-Bills with the allocation as % debt holdings at 10-year high of 2.8%.
What these flows demonstrate is that, despite the still resilient market, investors are heading for the exits in ever greater numbers. They may have a point: as Hartnett notes, there have been at least 4 distinct bearish anomalies in recent days:
  1. Markets oversold...yet risk can’t catch a bid
  2. China easing (the China Monetary Conditions index is at a 14-month high)...yet SHCOMP, CNY, EEM can’t catch a bid
  3. US fiscal stimulus of $1.5tn…yet US small caps now flat YTD and domestic cyclicals getting destroyed
  4. Treasuries >3%...yet bank stocks falling & US$ no longer rising
To this list one can also add earnings, which are expected to post near record growth for the 3rd consecutive quarters, yet markets appear oblivious.
So with fundamentals increasingly ignored, the technicals are especially critical, as Marko Kolanovic noted earlier.
Specifically, Hartnett writes that the more fragile & volatile the market, the more technically obedient the investor: It is hardly a surprise that everyone expects a year-end rally, and if SPX & Nasdaq hold 2678 & 7485, then the BofA strategist expects a rally led by a barbell of oversold “growth” e.g. social media & distressed “value” (EM, Italy, homebuilders, banks).
However, if these key levels fail, then beware a flush lower via oil, US tech, private equity, US small caps, and US buyback winners.
To time any potential breakdowns (or breakups), BofA urges clients to always watch leaders & laggards: bear market leaders are XBT, EMD, XHB, SX7E, BKX, SOX...which are all yet to trough... at the same time, bear market laggards are oil, US$, RTY, US HY, FAANG, buyback winners, PSP: these are all starting to crack.
But perhaps the biggest question is what could stop the Fed's tightening cycle. Here, according to Hartnett, traders should watch key credit spreads that would cause Fed to stop tightening, including US IG BBB @ 147bp (v.s 115bp low Feb’18), US CLO spread @ 380 (vs 315bps low Jan’18).
Note that while the US has remained resilient, spreads have already widened in EM, and Europe (as discussed recentlyand especially Italy. Furthermore, abrupt declines in bank stocks and  commercial real estate (yesterday's OZK earnings are a troubling indicator) are other Fed-stopping catalysts.
And while Hartnett warns that there is likely more downside on Wall Street for the next 6 months, it should be noted that a lot of damage has already been done:
  • US Treasuries: on course for 3rd largest annual loss since 1970 (-9.7%)
  • US IG credit: on course for 3rd largest annual loss since 1970 (-3.8%)
  • 1609 out of 2767 (58%) ACWI global stocks & 876 out of 1889 (46%) NYSE stocks in bear markets
Also don't forget the biggest surprise of 2018: the US decoupling from the rest of the world - with the S&P still hanging in there, global stock markets have been almost 9 months into bear market.
Finally, BofA's trade recommendations to capitalize on the market's ongoing weakness, at least until the Fed pauses and China stimulus bites:
  • Sell rallies in risk assets
  • Cash over bonds & stocks
  • High quality over highly leveraged assets
Fonte: qui

Charting China's Imminent Implosion

Debt is money spent in the present and an obligation to be repaid in the future.  Given this, I thought I'd contrast China's population of young versus their obligation to be repaid in the future.
The chart below shows the 0 to 24 year old Chinese population (green line) versus Chinese debt (red line) and GDP (black line).  The 0 to 24 year old Chinese population swelled by over 300 million from 1950 to it's ultimate peak in 1991.  Since that peak, the total population of young in China has fallen by 176 million, or a 30% decline in the number of children across China.  Moving forward, the UN medium estimate hopes the formal elimination of the one child policy will simply slow the rate of decline in the population...but by no means will China's fast declining childbearing population (those aged 15-44) nor disproportionately young male population potentially be offset by a slightly less negative birth rate.  Contrast that with the quantity of debt being forcibly injected into a nation that faces a massive imminent population decline.
To put that debt into perspective, the chart below shows that total debt and annual GDP each divided by the 0 to 24 year old Chinese population.  As of 2018, every child and young adult in China under the age of 25 is presently responsible for over $100 thousand dollars in debt while the annual economic activity (GDP) created by all this debt continues to lag ever faster. 
And the coming decade only worsens as the young population continues its unabated fall and debt creation (absent concomitant economic growth) continues soaring... building more capacity all for a population that is set to collapse?!?
China's predicament and reaction to it are not particularly unique...but given China's size, the ultimate global impact of China's slow motion train wreck will be unprecedented... particularly as their 15 to 64 year old population is now in indefinite decline.  Chart below shows annual change in Chinese 15 to 64 year old population, in both millions (green columns) and percentage (blue line).
Massive overcapacity (thanks to over a decade of government mandated mal-investment) versus a ever swifter declining base of consumption does not add up to a burgeoning middle class or a happy ending.
*  *  *

Extra Credit -

Just for comparative discussion sake, below is the US 15 to 24 year old population (orange line) and employment among them (blue line) since 1979 (the year of peak employment among 15 to 24yr/old Americans).
And just for fun, US federal debt per capita of the 0 to 24 year old US population (a bit unfair comparison as I'm only showing US federal debt vs. 0 to 24yr/olds against China total debt vs. 0-24yr/olds above...but you get the idea).