9 dicembre forconi: 04/13/18

venerdì 13 aprile 2018

Why Systems Fail

Since failing systems are incapable of structural reform, collapse is the only way forward.
Systems fail for a wide range of reasons, but I'd like to focus on two that are easy to understand but hard to pin down.
1. Systems are accretions of structures and modifications laid down over time.Each layer adds complexity which is viewed at the time as a solution.
This benefits insiders, as their job security arises from the need to manage the added complexity. The new layer may also benefit an outside constituency that quickly becomes dependent on the new layer for income. (Think defense contractors, consultants, non-profits, etc.)
In short order, insiders and outsiders alike habituate to the higher complexity, and everyone takes it for granted that "this is how things work." Few people can visualize alternatives, and any alternative that reduces the budget, payroll or power of the existing system is rejected as "unworkable."
In this set of incentives, the "solution" is always: we need more money. If only we had another $1 million, $1 billion or $1 trillion, we could fix what's broken.
But increasing the budget can't fix what's broken because it doesn't address the underlying sources of systemic failure.
Those benefiting from the status quo will fight tooth and nail to retain their jobs and benefits, and so deep reform is essentially impossible, as the insiders and constituencies of each layer resist any reform that might diminish their security/income.
As a result, new layers rarely replaces previous layers; the system becomes more and more inefficient and costly as every new layer must find work-arounds and kludgy fixes to function with the legacy layers.
Eventually, the system becomes unaffordable and/or too ineffective to fulfill its mission.
2. The organization is incapable of instituting deep reforms due to organizational sclerosis and leadership who only wants to hear "good news."Organizational sclerosis isn't just the result of insiders clinging to their job; the structure itself has lost the feedback loops and accountability needed to radically restructure a failing organization.
It's easy for leadership to start demanding what it wants to hear rather than the inconvenient and troublesome truth. Due to the tendency to "shoot the messenger bearing bad news," managers fudge their delivery dates and numbers. Lacking real data and metrics, management fails to recognize the gravity of the situation and makes catastrophically erroneous decisions based on false or massaged reports.
These dynamics can manifest in both private-sector corporations and public-sector agencies. Many public school districts have failed for these reasons despite ever-rising budgets, and the former leader of mobile telephony, Nokia, self-destructed in large part as a result of #2.
One of Steve Jobs' first actions when he took control of failing-fast Apple in 1997 was to slash product lines and strip out the corporate layers that had accumulated to service this ineffective complexity.
All of this contrasts with self-organizing networks which lack the hierarchy necessary for sclerosis, self-serving insiders and fatally blinded management. Since "this is the way the system works," we have a hard time imagining how public agencies and corporations might be obsoleted by self-organizing, opt-in, transparent rules-based networks.
Since failing systems are incapable of structural reform, collapse is the only way forward. Unfortunately collapse doesn't guarantee success; if the rot is deep enough, the wherewithal to assemble a new and more sustainable system may be lacking.
Three charts of system failure:
Of related interest:
The System Has Failed (February 22, 2016)

Citi: "Fed Policy Is Now Restrictive" A Clear Negative For Stocks

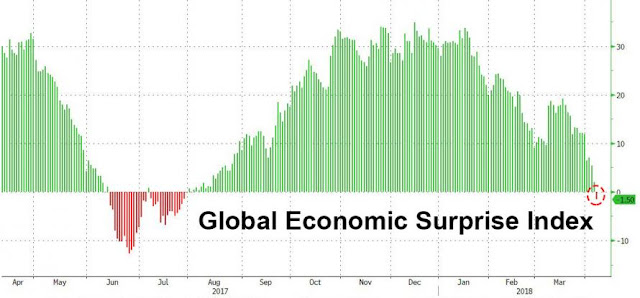
Whether one looks at "hard" data, "soft"  sentiment surveys, or general economic conditions - Friday's unexpected plunge in payrolls certainly a case in point - there is no mistaking it: the economy is slowing down...
... to the point where over the weekend several banks have raised red flags the business cycle may be approaching its end, with JPMorgan pointing out that the OIS forward curve has inverted for the first time since 2005, suggesting either Fed policy error or the market is "pricing in end-of-cycle dynamics"...
... while Morgan Stanley this morning warning that "there are clear signs that we are in the late-cycle phase", and the end of the business cycle could arrive faster than expected, if protectionism escalates or if record debt gets repriced higher.
Then, over the weekend, Citi's global macro strategy team also published a research note discussing the recent sharp economic slowdown, noting that it too is "getting a lot of client enquiry about the cycle and asset markets",  although of a highly volatile nature, as market first feared inflation and overheating, and just two months later, a growth slowdown.
February Inflation Scare…
In February, however, markets seemed to fear a shift from goldilocks to reflation i.e. higher inflation with strong real growth. The catalyst for a market inflation scare was likely the 2 Feb payrolls report with a big upside AHE miss. Meanwhile, indicators of growth such as cyclicals vs. defensives, growth vs. value, yields and base metals all suggested that the initial correction was not a growth scare (Figure 4 LHS).
…Morphed Into a Growth Scare
However, as Figure 4 RHS indicates, the second leg lower in equities seems to have morphed more into a growth scare led by a leg lower in base metals, an asset class that normally does well if inflation concerns are prevalent. With nominal yields, real yields and breakevens falling, money market curves flattening to price less tightening and oil also off, it’s hard to escape the conclusion that markets are suddenly less confident about the growth outlook.
The slowdown is evident across main street as well:
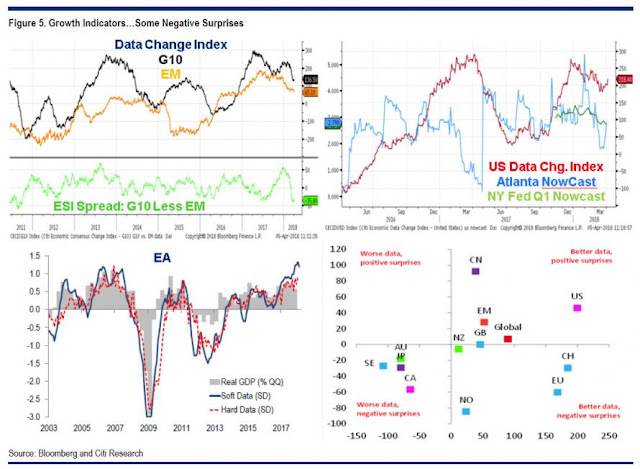
  • G10 data momentum is easing but remains above trend. Ditto EM data momentum, albeit EM data has a bit less momentum. But EM data surprises are stronger than G10 with very strong upside “news” in China/ APAC (Figure 5, top LHS)
  • US data has been pretty weak in Q1 leading to downwards revisions to nowcasts (Figure 5, top RHS)
  • EA soft data has come off a fair bit recently but the gap from soft to hard data persists (Figure 5, bottom LHS) so weaker surveys may have limited implications for real GDP and other bottom line numbers
  • Overall, countries occupy three of four possible states with regard to data momentum and economic surprises. However, there are some where data momentum is weak and surprises are negative (Figure 5 bottom, RHS)
But wait, there's more: while recent data globally is deteriorating, credit impulse numbers and Citi's leading indicators suggest that growth expectations may drift even lower in the coming months.  For example, Figure 7 LHS shows G4 and China credit impulse vs G10 data momentum and considering that credit is a leading indicator to data, the bottom may be about to fall out of the global economy due to China's credit slowdown, something we first noted last year.
Needless to say, an economic slowdown at a time when the US is about to inject an unprecedented fiscal stimulus is bad news for the business cycle, as it suggests the fiscal multipler is broken, and confirms what JPM noted about the inversion of the OIS swap as a harbinger of the end of the business cycle. Meanwhile, it also indicates that any hopes the Fed may have had of hiking 2/3 more times in 2018 and another 3 times in 2019 are now officially dead. Here is how Citi's Jeremy Hale puts it: "we calculate that the Fed has already moved into slightly restrictive territory vs. equilibrium rates and that further tightening from here will be a growth and risk asset negative."
Some more details:
First, the real Fed Funds rate has now risen above two of the three measures of the Laubach Williams Natural Interest Rate (LWNIR - R*) suggesting that, for the first time since late 2007, policy has become restrictive (Figure 6 LHS).
As the spread between R* and the actual real Funds declines the yield curve flattens. When the spread is negative, the risk of equity bear markets also increases though it took much longer from late 2005 to 2007 than in 2000 (Figure 6 RHS).
Of course, if the Fed's tightening cycle is now effectively over based on what r-star suggests, and yet the dot plot implies another 5+ rate hikes for the next 2 years, the consequences for risk assets as a result of the slower growth would be dire, or as Citi explains:
if consensus is too high, this implies further negative surprises to come. Even lower ESI readings for major economies probably means downside risks to equities, commodity prices and UST yields3. But the $ is probably relatively immune both because exchange rates are relative prices and because financing concerns not rates/ growth are currently more important for FX.
More ominously, Citi cautions that if we are indeed moving away from goldilocks to slower growth and higher inflation (i.e., at least a mild degree of stagnation to some extent) equities do very poorly historically with government bonds (and credit) relative winners, something that Albert Edwards warned about just this afternoonOn the other hand, if we move to lower growth and lower inflation (i.e., recession) "then EM and commodities typically perform worse, DM equities do a little better (presumably anticipating Central Bank support) but there are outsize gains in govvies and credit."
* * *
So with a global slowdown forcing investors to reassess everything, a "late cycle" Fed policy mistake suddenly on the table, and a US recession rearing its head for the first time in 9 years, is Citi suggesting you sell? Not necessarily.  According to Hale, "the brave could try to buy the dip...
... because, as he concludes, while "a weakening cyclical dynamic may be less positive and a restrictive Fed policy is flattening the yield curve... the lags between these variables and eventual market tops can be a year or more."
In other words, yes, we could see a major crash at any moment, but will someone please think of those last 5-10% in S&P upside before the recession?
Or, as we simplified it last week, "confused? Just buy the fucking all time high..."
Fonte: qui

China’s Five Options in the Trade War with the U.S. “Rare Earths” Are China’s Most Potent Weapon In A Trade War

After Trump ordered the USTR to consider an additional $100BN in tariffs, something we said on Wednesday would happen if the market was dumb enough to allow Trump to think he had a trade war victory by closing green…
…China has suddenly found itself in a quandary: as we showed first thing this morning, if Beijing were to continue responding to the US in a “tit-for-tat”, it would be unable to retaliate to the latest Trump salvo of a total $150 billion in tariffs for the simple reason that the US does not export $150 billion in products to China.
S&P 500 EXTENDS GAIN ABOVE FRIDAY'S CLOSE, UP AS MUCH AS 1.15%

Seeing favorable market response, Trump next raises China tariffs to $100BN
Which doesn’t mean that China is out of options; quite the contrary. The problem is that virtually everything and anything else that Beijing can do, would be a significant escalation. In fact, the five most frequently cited options are all considered “nuclear” and would promptly lead to an even more aggressive response from Washington.
Here are the five “nuclear” options that China is currently contemplating:
  1. A Currency Depreciation. A sharp, one-time yuan devaluation, like the one Beijing unexpectedly carried out in August 2015, could be used to offset some of the effect of tariffs.
  2. Sales of US Treasurys. Chinese authorities could sell some of its large official-sector holdings of US Treasuries, which would lead to a tightening of US financial conditions.
  3. Block US services. Chinese authorities could limit access for US companies to the Chinese domestic market, particularly in the services sector, where the US exports $56 billion in services annually and runs a $38 billion surplus
  4. Curb US oil shipments. According to Petromatrix, China is one of the biggest importers of U.S. crude oil at 400kb/d, so any counter-tariffs on crude could become very heavy for the U.S. supply and demand picture. Such a move would weigh on U.S. prices and spill over to global oil pricing. As Petromatrix adds, the market would need to start balancing downward price risk of trade-war escalations with upside risk of Iran sanctions as oil flows could be about the same.
All of the above are mostly self-explanatory. The fifth option is one we first previewed back last August, in “Rare Earths Are China’s Most Potent Weapon In A Trade War.” Here is a quick reminder:
In October 1973, the world shuddered when the Arab members of the Organization of Petroleum Exporting Countries imposed an oil embargo on the United States and other nations that provided military aid to Israel in the Yom Kippur war. At the same time, they ramped up prices. The United States realized it was dependent on imported oil — and much of that came from the Middle East, with Saudi Arabia the big swing producer. It shook the nation. How had a few foreign powers put a noose around the neck of the world’s largest economy?
Well, it could happen again and very soon. The commodity that could bring us to our knees isn’t oil, but rather a group of elements known as rare earths, falling between 21 and 71 on the periodic table.
This time, just one country is holding the noose: China.
China controls the world’s production and distribution of rare earths. It produces more than 92 percent of them and holds the world in its hand when it comes to the future of almost anything in high technology.
Rare earths are great multipliers and the heaviest are the most valuable. They make the things we take for granted, from the small motors in automobiles to the wind turbines that are revolutionizing the production of electricity, many times more efficient. For example, rare earths increase a conventional magnet’s power by at least fivefold. They are the new oil.
Rare earths are also at work in cell phones and computers. Fighter jets and smart weapons, like cruise missiles, rely on them. In national defense, there is no substitute and no other supply source available.
Today, The Week‘s Jeff Spross picks up on this topic, and in an article “How China can win a trade war in 1 move” writes that “if things do spiral into all-out trade war, it’s worth noting China has a nuclear option. I’m referring to rare earth metals.”
These are elements like dysprosium, neodymium, gadolinium, and ytterbium. They aren’t actually rare, but they do play crucial roles in everything from smart phones to electric car motors, hard drives, wind turbines, military radar, smart bombs, laser guidance, and more. They’re also quite difficult to mine and process.
Some more details, and the reason why none of this is new to those who have been following the rare earth space and China’s brief trade war with Japan back in 2010/2011:
Basically, if China really wanted to mess with America, it could just clamp down on these exports. That would throw a massive wrench into America’s supply chain for high-tech consumer products, not to mention much of our military’s advanced weapons systems.
In fact, China isn’t just America’s major supplier of rare earth metals; it’s the rest of the globe’s major supplier as well. And in 2009, China began significantly clamping down on its rare metal exports. Once, China briefly cut Japan off entirely after an international incident involving a collision between two ships. This all eventually led to a 2014 World Trade Organization spat, with America, Japan, and other countries on one side, and China on the other.
How did we get to this position where China has a near monopoly on rare earths:
Much of the story centers around Magnequench, an American company that emerged out of General Motors in the 1980s. It specialized in the magnets that account for most of the final components created from rare earth metals. But in 1995 Magnequench was bought out by a consortium that included two Chinese firms who took a controlling 62 percent majority share in the company. They also bought a big rare earth magnet plant in Indiana. Eventually, Magneuquench’s manufacturing capacities were moved to China, and the Indiana plant was shut down.
Executive branch regulators do wield power over foreign investment in and buyouts of American companies, particularly through the Committee on Foreign Investment in the U.S. (CFIUS). But this was the post-Cold War 1990s, when optimistic enthusiasm for globalized free market trade was at a peak. CFIUS approved the initial takeover of Magnequench in 1995 under the Clinton administration, as well as the later shutdown of the Indiana plant in 2003 under the Bush administration.
Lawmakers and the Government Accountability Office criticized the agency and both administrations for their lackadaisical approach to the issue. Hillary Clinton even struck a rather Trump-ian note in 2008, trying to turn Magequench’s sale to China into a campaign issue. But it was a tricky topic, given how her husband’s administration got the ball rolling. So rare earth metals have occasionally turned into a political hot potato, but usually for only brief periods.
Which then takes us back to our August preview of precisely where we are today:
At present, the rare earths threat from China is serious but not critical. If President Donald Trump — apparently encouraged by his trade adviser Peter Navarro, and his policy adviser Steve Bannon — is contemplating a trade war with China, rare earths are China’s most potent weapon.
A trade war moves the rare earths threat from existential to immediate.
In a strange regulatory twist the United States, and most of the world, won’t be able to open rare earths mines without legislation and an international treaty modification. Rare earths are often found in conjunction with thorium, a mildly radioactive metal, which occurs in nature and doesn’t represent any kind of threat.
However, it’s a large regulatory problem. The Nuclear Regulatory Commission and the International Atomic Energy Agency have defined thorium as a nuclear “source material” that requires special disposition. Until these classifications, thorium was disposed of along with other mine tailings. Now it has to be separated and collected. Essentially until a new regime for thorium is found, including thorium-powered reactors, the mining of rare earths will be uneconomic in the United States and other nuclear non-proliferation treaty countries.
Congress needs to look into this urgently, ideally before Trump’s trade war gets going, according to several sources familiar with the crisis. A thorium reactor was developed in the 1960s at the Oak Ridge National Laboratory in Tennessee. While it’s regarded by many nuclear scientists as a superior technology, only Canada and China are pursuing it at present.
Meanwhile, future disruptions from China won’t necessarily be in the markets. It could be in the obscure but vital commodities known as rare earths: China’s not quite secret weapon.
Of course, there is no way of knowing if China will proceed with a rare earth export ban as its response, or whether it will pick any of these options. However, for those who are growing concerned – or convinced – that it’s only going to get worse from here, there is good news: the VanEck Rare Earth ETF REMX makes it easy to make a substantial profit from the first nuclear trade war, should China clamp down on rare earth metals, sending their price to where they traded when China waged a brief trade war with Japan in 2011, when the ETF hit an all time high of $114. Needless to say, should China lock out the US, the price of rare earths would soar orders of magnitude higher.

Q4 2008 Vs Q1 2018... Apocalypse Then Versus Euphoria Now?!?

I'd like to discuss the fourth quarter of 2008 vs. the first quarter of 2018.  The two quarters in which the US undertook the greatest increases in federal debt but supposedly represent entirely different outcomes (I'm excluding and smoothing out the Q3 2015 debt deluge after the Q1-Q2 debt ceiling debate).
The chart below shows total federal debt (red line) in perspective against real inflation adjusted GDP (blue line), the federal funds rate (shaded brown), and the 10yr Treasury yield (light blue shading).  It ain't a pretty picture.

During Q4 of 2008, the US undertook $675 billion in federal debt, dropped the FFR essentially to zero, and saw the 10 year Treasury yield drop to 2.3% while real GDP fell by over $200 billion.
During Q1 of 2018, the US similarly undertook $625 billion in federal debt.  But conversely in Q1 hiked the FFR to 1.7%, the 10 year yield rose to 2.8%, and Q1 real GDP likely rose around $125 billion.
Since the completion of Q4 '08, Federal debt has risen 97% (+$10.4 trillion) while real GDP has risen 19% (+$2.8 trillion).  Over this period, federal debt has consistently been rising 4x's faster than inflation adjusted economic activity...and as Q1 2018 highlighted, this trend isn't improving.
But looking at Q4 '08 and Q1 '18 Treasury holdings (side by side), something very strange has taken place.  In late 2008, as the financial and economic wheels were coming off and assets were abandoned for the comparative "safety" of Treasury's...the domestic public added a then record $324 billion in US debt to their holdings.  However, in early 2018, as the stock market and housing markets were reaching euphoric highs...somehow the same domestic sources added a mind blowing approx. $750 billion in Treasury debt to their asset hoard?!?
The chart below shows the quarterly net issuance on the left and the change in holdings by the four sources of buying on the right.  What you will notice is a seemingly unbelievable surge in US Treasury holdings by the "domestic public".  In Q4 '08, outstanding Treasury debt rose by $676 billion and although the Federal Reserve took none of that (QE didn't start until Q1 2009), the Intra-Governmental surplus (SS, etc.) ate up $77 billion (reducing marketable debt), foreigners (particularly China) scooped up $275 billion, and the domestic public (banks, insurers, pensions, etc.) was left to digest the remaining $324 billion.
Compare Q4 '08 to Q1 2018; Federal Reserve holdings declined by $30 billion (and the Fed's balance sheet is set to shrink by hundreds of billions annually through 2020) , the Intra-Governmental holdings fell by $16 billion as benefits paid out outpaced surplus revenue (likewise, this selling is set to accelerate as surplus turns to outright deficit), foreigners likely continued selling (foreign holdings, led by Chinese/Japanese selling, have declined by $65 billion from October through January) but the final Treasury TIC data won't be available until this Summer...so I simply left foreign holdings unchanged.  This meant about three quarters of a trillion in net new Treasury debt was swallowed up by "domestic sources" in the first three months of 2018.  Further details on the situation are detailed here Who Will Buy Those Trillions of US Treasurys???
Seems a deeper dive into who exactly those "domestic" sources are is in order.  Thanks to the Treasury Bulletin...we've got some idea.  As the chart below highlights since 2007, there are two sources doing all the heavy lifting.

Since QE ended in Q4 of 2014, Treasury debt has ballooned by $3 trillion, of which mutual funds and a grouping titled "other"have added over $2 trillion (taking in 70% of the net increase in Treasury debt).  For those wondering...according to the Treasury, "other" includes individuals, GSE's, brokers/dealers, bank personal trusts and estates, corporate and non-corporate business, and other investors. 
The holdings of this group of "others" and mutual funds have mushroomed in size compared to those of insurers, banks, pension funds, or "private" investors.
So, consider...
  • Issuance of new debt will continue to rapidly outpace growth in economic activity (or the taxation to pay for any of this)
  • Traditional sources of Treasury buying are turning into secular sources of selling (Fed, IG, foreigners, Petro-Yuan, etc.)
  • Assets remain near record highs indicating there is little to no selling with which to fund the domestic Treasury purchases
  • Yields on US debt have risen but remain near long term lows and are at best break evens with inflation...and far below acceptable long term returns for most fund managers
It is hard to believe all of this adds up to anything more than state level fraud. 
That America's ability to fund it's massive deficits via the Treasury market and manage the interest paid on that rapidly growing pile of debt are no longer dependent on market participants...but likely being enforced by the very pointy end of American "diplomacy".