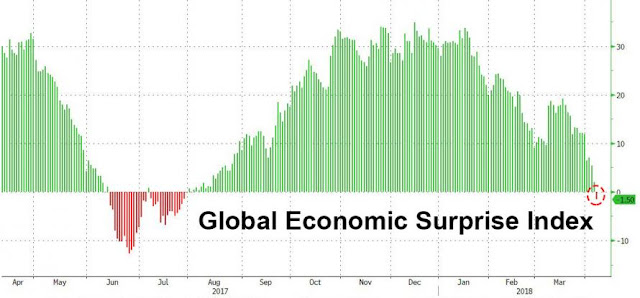
Whether one looks at "hard" data, "soft" sentiment surveys, or general economic conditions - Friday's unexpected plunge in payrolls certainly a case in point - there is no mistaking it: the economy is slowing down...
... to the point where over the weekend several banks have raised red flags the business cycle may be approaching its end, with JPMorgan pointing out that the OIS forward curve has inverted for the first time since 2005, suggesting either Fed policy error or the market is "pricing in end-of-cycle dynamics"...
... while Morgan Stanley this morning warning that "there are clear signs that we are in the late-cycle phase", and the end of the business cycle could arrive faster than expected, if protectionism escalates or if record debt gets repriced higher.
Then, over the weekend, Citi's global macro strategy team also published a research note discussing the recent sharp economic slowdown, noting that it too is "getting a lot of client enquiry about the cycle and asset markets", although of a highly volatile nature, as market first feared inflation and overheating, and just two months later, a growth slowdown.
February Inflation Scare…In February, however, markets seemed to fear a shift from goldilocks to reflation i.e. higher inflation with strong real growth. The catalyst for a market inflation scare was likely the 2 Feb payrolls report with a big upside AHE miss. Meanwhile, indicators of growth such as cyclicals vs. defensives, growth vs. value, yields and base metals all suggested that the initial correction was not a growth scare (Figure 4 LHS).…Morphed Into a Growth ScareHowever, as Figure 4 RHS indicates, the second leg lower in equities seems to have morphed more into a growth scare led by a leg lower in base metals, an asset class that normally does well if inflation concerns are prevalent. With nominal yields, real yields and breakevens falling, money market curves flattening to price less tightening and oil also off, it’s hard to escape the conclusion that markets are suddenly less confident about the growth outlook.
The slowdown is evident across main street as well:
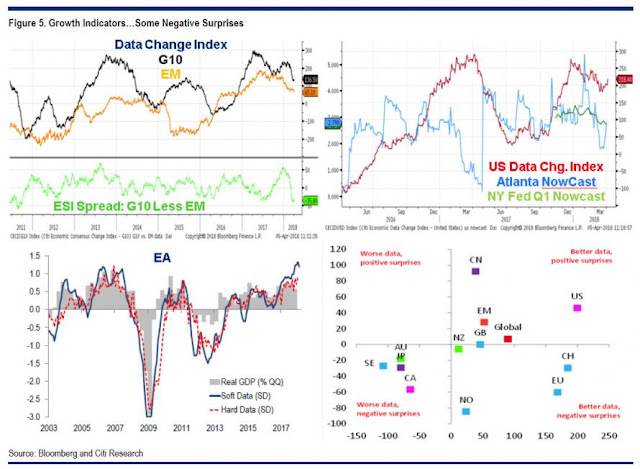
- G10 data momentum is easing but remains above trend. Ditto EM data momentum, albeit EM data has a bit less momentum. But EM data surprises are stronger than G10 with very strong upside “news” in China/ APAC (Figure 5, top LHS)
- US data has been pretty weak in Q1 leading to downwards revisions to nowcasts (Figure 5, top RHS)
- EA soft data has come off a fair bit recently but the gap from soft to hard data persists (Figure 5, bottom LHS) so weaker surveys may have limited implications for real GDP and other bottom line numbers
- Overall, countries occupy three of four possible states with regard to data momentum and economic surprises. However, there are some where data momentum is weak and surprises are negative (Figure 5 bottom, RHS)
But wait, there's more: while recent data globally is deteriorating, credit impulse numbers and Citi's leading indicators suggest that growth expectations may drift even lower in the coming months. For example, Figure 7 LHS shows G4 and China credit impulse vs G10 data momentum and considering that credit is a leading indicator to data, the bottom may be about to fall out of the global economy due to China's credit slowdown, something we first noted last year.
Needless to say, an economic slowdown at a time when the US is about to inject an unprecedented fiscal stimulus is bad news for the business cycle, as it suggests the fiscal multipler is broken, and confirms what JPM noted about the inversion of the OIS swap as a harbinger of the end of the business cycle. Meanwhile, it also indicates that any hopes the Fed may have had of hiking 2/3 more times in 2018 and another 3 times in 2019 are now officially dead. Here is how Citi's Jeremy Hale puts it: "we calculate that the Fed has already moved into slightly restrictive territory vs. equilibrium rates and that further tightening from here will be a growth and risk asset negative."
Some more details:
First, the real Fed Funds rate has now risen above two of the three measures of the Laubach Williams Natural Interest Rate (LWNIR - R*) suggesting that, for the first time since late 2007, policy has become restrictive (Figure 6 LHS).As the spread between R* and the actual real Funds declines the yield curve flattens. When the spread is negative, the risk of equity bear markets also increases though it took much longer from late 2005 to 2007 than in 2000 (Figure 6 RHS).
Of course, if the Fed's tightening cycle is now effectively over based on what r-star suggests, and yet the dot plot implies another 5+ rate hikes for the next 2 years, the consequences for risk assets as a result of the slower growth would be dire, or as Citi explains:
if consensus is too high, this implies further negative surprises to come. Even lower ESI readings for major economies probably means downside risks to equities, commodity prices and UST yields3. But the $ is probably relatively immune both because exchange rates are relative prices and because financing concerns not rates/ growth are currently more important for FX.
More ominously, Citi cautions that if we are indeed moving away from goldilocks to slower growth and higher inflation (i.e., at least a mild degree of stagnation to some extent) equities do very poorly historically with government bonds (and credit) relative winners, something that Albert Edwards warned about just this afternoon. On the other hand, if we move to lower growth and lower inflation (i.e., recession) "then EM and commodities typically perform worse, DM equities do a little better (presumably anticipating Central Bank support) but there are outsize gains in govvies and credit."
* * *
So with a global slowdown forcing investors to reassess everything, a "late cycle" Fed policy mistake suddenly on the table, and a US recession rearing its head for the first time in 9 years, is Citi suggesting you sell? Not necessarily. According to Hale, "the brave could try to buy the dip...
... because, as he concludes, while "a weakening cyclical dynamic may be less positive and a restrictive Fed policy is flattening the yield curve... the lags between these variables and eventual market tops can be a year or more."
In other words, yes, we could see a major crash at any moment, but will someone please think of those last 5-10% in S&P upside before the recession?
Or, as we simplified it last week, "confused? Just buy the fucking all time high..."
Fonte: qui


Nessun commento:
Posta un commento