9 dicembre forconi: Federal Reserve
Visualizzazione post con etichetta Federal Reserve. Mostra tutti i post

giovedì 13 settembre 2018

The End Of Cheap Debt: The Fall & Rise Of Interest Rates

Perhaps the greatest single trend impacting the next decade

Total debt (public + private) in America is currently at a staggering $67 trillion.
That number has been rising fast over the past 47 years, following the US dollar's transformation into a fully-fiat currency in August of 1971.
Perhaps this wouldn't be such a big concern were America's income, measured by GDP, growing at a similar rate. But it's not.
Growth in debt has far outpaced GDP, as evidenced by this chart:
In 1971, the US debt-to-GDP ratio was 1.48x. That's roughly the same multiple it had averaged over the prior century.
But today? That ratio has spiked to to 3.47x, more than doubling over just 4 decades.
There are many troubling conclusions to draw from this, but here's a simple way to look at it: It's taking more and more debt to eke out a unit of GDP growth.
Put in other words: the US economic engine is seizing up, requiring increasingly more effort to function.
At some point -- quite possibly some point soon -- the economy will no longer be able to grow because all of its output must be used to service the ballooning debt load rather than future investment.
Accelerating this point of reckoning are two major recent trends: rising interest rates and the end of global QE.
Why? Because much of the recent explosion in debt has been fueled by central bank policy:
  • Interest rates have been on a steady decline since the 1980s, making debt increasingly cheaper to issue and to service.
  • Since 2008, central banks have been voracious buyers of debt. Countries/companies have been able to borrow $trillions, enabled (both directly and indirectly) by these "buyers of last resort".
But both of those trends are ending, fast.
Interest rates have been rising off of their all-time rock-bottom lows over the past two years. While still low by historic standards, the rise is certainly material enough already to make the US' $70 trillion in total debt more expensive to service, putting an even greater weight on America's already-burdened economy.
And all indicators point to even higher rates ahead; with the Federal Reserve expected to increase the federal funds rate another 50% by 2020:
These higher rates make the US debt overhang even more expensive to service, while also forcing valuations downwards for major asset classes like bonds, housing and equities (the prices of which are derived in part by interest rates, as explained here).
These higher expected rates also co-incide with the cessation of global quantitative easing (QE). The world's major central banks have announced that they will cease making purchases by 2020:
Without these indiscriminate buyers-of-last-resort, debt issuers will need to offer higher rates to entice the next marginal buyer. How much higher will rates need to rise as a result? It's pretty easy to make the argument for "a lot".
We've been talking quite a bit recently about the implications of hitting America's "Peak Debt" threshold with David Stockman in preparation for our upcoming seminar with him next week. He's extremely concerned. Here's what he has to say on the matter (4m:42s):
He also fears that we have the exact wrong expertise in place inside our financial markets to deal with the coming crisis, as there's an entire generation of Wall Streeters who have never seen rates as high as they are today. More than that, there's virtually no one left in today's financial industry with actual experience operating within a rising interest rate environment (2m:09s):
James Howard Kunstler, another co-presenter at next week's seminar, is similarly worried that the current state of the financial system is so fragile that a "convulsion" (i.e., a painful downdraft that violently reprices assets) is inevitable at this point (5m:46s):
If you're wondering what warning signs to watch for closely, or what steps to take in advance of the market convulsion predicted by Kunstler and Stockman, we'll be diving deeply into those at next week's Peak Prosperity New York City Summit on Sunday, Sep 16, 2018. You'll have the chance to meet these experts personally, spend the day with them, and ask them your most burning questions.
Fonte: qui
To learn more about this event, click here.
Creativa Images/Shutterstock

martedì 21 agosto 2018

It’s Not Just Turkey: There Is A Dollar Liquidity Storm Ahead Of Us

Experts are warning that 95 on the dollar index is the line in the sand, and we’re over 96 now. Here’s what experts say happens next…
by Brian Maher of Daily Reckoning
“It’s not just Turkey,” we are warned.
“The dollar liquidity storm is ahead of us — buckle up.”
Forewarned, we acknowledge Nedbank strategists Neels Heyneke and Mehul Daya for the advisory.
Where will it likely strike next?
Answer anon…
We begin with a brief excursion into the mysteries of the international monetary system… and the “Triffin dilemma.”
In 1959 Belgian-American economist Robert Triffin alighted upon a thumping paradox…
A nation boasting a global reserve currency carries a unique burden, he observed.
It must surrender partial control of its own monetary policy. It must also serve a global master.
That is, it must issue a superabundance of currency to lubricate the gears of global commerce.
Absent that continuous flow, the machinery could seize… and the world could sink into depression.
The issuing nation must therefore be willing to endure vast, sustained trade deficits.
The less wares the issuing nation buys from the world, after all, the less currency is available for global duty.
As the issuer of the world’s leading currency, this is precisely the burden the United States carries upon its shoulders.
Explains the IMF:
If the United States stopped running balance of payments deficits, the international community would lose its largest source of additions to reserves. The resulting shortage of liquidity could pull the world economy into a contractionary spiral, leading to instability.
The dollar accounts for some 87% of overall foreign exchange trades.
And over 60% of foreign exchange reserves are still held in dollars.
But the burden of global responsibility weighs with time…
The U.S. has endured an $11 trillion cumulative trade deficit with rest of the world since 1989.
Massive trade deficits are twinned with equally massive account deficits.
The United States ran a $466 billion current account deficit last year alone… accounting for 43% of all global deficits.
And its foreign debt swells to dimensions beyond all sustainability.
According to recent data from TreasuryDirect.gov, the government will shell out nearly a half trillion dollars for debt service this year.
A goodly portion of that amount it must pay to overseas creditors.
Thus what is “good for the world” eventually becomes a domestic bellyache.
As Investopedia notes:
[Ensuring global liquidity] causes a trade deficit for the currency-issuing country, but makes the world happy. If the reserve currency country instead decides to focus on domestic monetary policy by not issuing more currency, then the world is unhappy.
By this standard, the world is growing “unhappy.”
The world — especially emerging markets — fattened on record amounts of dollar-denominated debt during those heady days of zero interest rates following the Great Recession.
Atop this dollar debt these nations piled additional debt.
“This huge debt pyramid was fine,” Jim adds — “as long as… dollars were flowing out of the U.S. and into emerging markets.”
But that situation no longer obtains…
The Federal Reserve has been raising interest rates since December 2015.
And, as of last October, reducing its balance sheet.
The great flow of dollar liquidity is therefore slowing… even going into reverse.
A stronger dollar means higher interest payments for nations that took on dollar-denominated debt.
And investors are fleeing softer emerging-market currencies for the mightier dollar.
Fewer dollars are therefore available to service the world’s mounting debt and support local economies.
The result is an emerging-markets crisis, as is unfolding in Turkey… and Argentina.
Argentina’s central bank just raised interest rates to a crushing 45% in order to relieve pressure on its peso.
Emerging-market woes began appearing late last year after the Fed began working down its balance sheet — a process that continues apace.
Coincidence?
Not according to Urjit Patel, head of the Reserve Bank of India:
Global spillovers did not manifest themselves until October of last year. But they have been playing out vividly since the Fed started shrinking its balance sheet.
The danger of course is that the dam busts… and the current crisis spreads beyond Turkey.
“Forget about Turkey’s woes,” warn the aforesaid Heyneke and Daya.
What is the next trouble spot, in their estimation?
Asia.
“Asia is the elephant in the room.”
“We believe Asia will be the next source of downside systemic risk for financial markets,” they continue.
Why Asia?
Asian nations assumed the greatest amount of dollar-denominated debt since 2009.
Stay tuned… as they say.
Watch the U.S. dollar index, warn these gentlemen, which tracks the dollar against competing currencies.
Ninety-five is the red line. Anything above 95 spells trouble, they warn:
We cannot stress enough the importance of the 95 level on the U.S. dollar index. A confirmed break above this level will mark the beginning of the next risk-off phase.
What is the dollar index’s present reading?
96.67.

domenica 27 maggio 2018

The Breaking Point Is Upon Us

Signs of collapse are suddenly everywhere around the world

martedì 19 dicembre 2017

Nomi Prins: 'Dark Money' Runs The World

Few people know financial markets’ biggest secret...
For the last 40 years, most people believed the stock market always goes up. Simply buy and hold long enough, the theory went, and you could sit back and watch the money accumulate in your account. No thought or hard work needed.
It was a nifty strategy — until the idea burned most investors in 2008. Almost a decade later, the scar tissue is still fresh for many investors.
Even today, after the U.S. stock market has rallied by 271% since the bottom on March 6, 2009 — nearly tripling investors’ money — only about half of Americans are invested in the stock market, according to NPR. That’s down from two-thirds compared to a decade ago.
The rest are in cash on the sidelines. Maybe that’s been you.
And who can blame you? “Fool me once, shame on you,” the saying goes. “Fool me twice, shame on me.”
Last June, Fortune surveyed readers. 71% of respondents said “the economic system in the U.S. is rigged in favor of certain groups.”
A few years earlier, the Los Angeles Times reported “Poll finds 64% of voters believe stock market is rigged against them…”
They’re not wrong.
Somebody’s made gains from all of those sectors in the stock market. It just hasn’t been Main Street.
Since I’ve left the world of big banking, I’ve made it my mission to change that. That leads me to the catalyst for my new project…
Dark money.
Dark money is the #1 secret life force of today’s rigged financial markets. It drives whole markets up and down. It’s the reason for today’s financial bubbles.
On Wall Street, knowledge of and access to dark money means trillions of dollars per year flowing in and around global stock, bond and derivatives markets.
I learned this firsthand from my career on Wall Street. My first full year working on Wall Street was in 1987.
I wasn’t talking about “dark money” or central bank collusion back then. I was just starting out.
Eventually, I would uncover how the dark money system works… how it has corrupted our financial system… and encouraged greed to the point of crisis like in 2008.
When I moved abroad to create and run the analytics department at Bear Stearns London as senior managing director, I got my first look at how dark money flows and its effects cross borders.
The “dark money” comes from central banks. In essence, central banks “print” money or electronically fabricate money by buying bonds or stocks. They use other tools like adjusting interest rate policy and currency agreements with other central banks to pump liquidity into the financial system.
That dark money goes to the biggest private banks and financial institutions first. From there, it spreads out in seemingly infinite directions affecting different financial assets in different ways.
Yet these dark money flows stretch around the world according to a pattern of power, influence and, of course, wealth for select groups. To be a part of the dark money elite means to have control over many. How elite is a matter of degree.
These is not built upon conspiracy theories. To the contrary, alliances make perfect sense and operate publicly. Even better, their exclusive dealings and the consequences that follow are foreseeable — but only if you understand how the system works and follow the dark money flows.
It’s easy to see how this dark money affects the stock market at a high level, because we can monitor its constant movement.
Here’s the smoking gun:
Dark Money
The red line shows you how much “dark money” the Federal Reserve has printed since 2008.
The blue line shows you the S&P 500.
They move together — more dark money drives the market higher. Much higher.
There are dark money charts from around the world, just like the one I showed you for the Federal Reserve and U.S. stock market.
Look at this “dark money” chart from Japan, for example:
Japan
The blue line shows the dark money created by their central bank, The Bank of Japan. The red line shows Japan’s major stock index, the Nikkei 225, going up as well. The dark money drove the market much higher over the past eight years.
Or, look at this “dark money” chart from the U.K.:
England
Again, the blue line shows the “dark money” created since 2009 by the U.K.’s central bank, The Bank of England. The red line shows how the FTSE 100, their stock index, has followed higher in lock-step.
To invest profitably in financial markets, you need to understand the hidden power relationships that drive financial and political events. Ideologies and personal associations among elites are oblivious to political party lines and international boundaries. So is dark money.

giovedì 7 dicembre 2017

This Time Is Different, It Just Ends The Same

This past weekend, I was in Florida with Chris Martenson and Nomi Prins discussing the current backdrop of the markets, economic cycles, and future outcomes. A bulk of the conversations centered around the current “everything bubble” that currently exists globally. Elevated valuations in stock prices, extremely low yields between in “junk bonds,” or intense speculation around “cryptocurrencies” all suggest we have entered once again into “bubble” territory.”
Let me state this:
“Market bubbles have NOTHING to do with valuations or fundamentals.”
Hold on…don’t start screaming “heretic” and building gallows just yet. Let me explain.
Stock market bubbles are driven by speculation, greed, and emotional biases – therefore valuations and fundamentals are simply a reflection of those emotions.
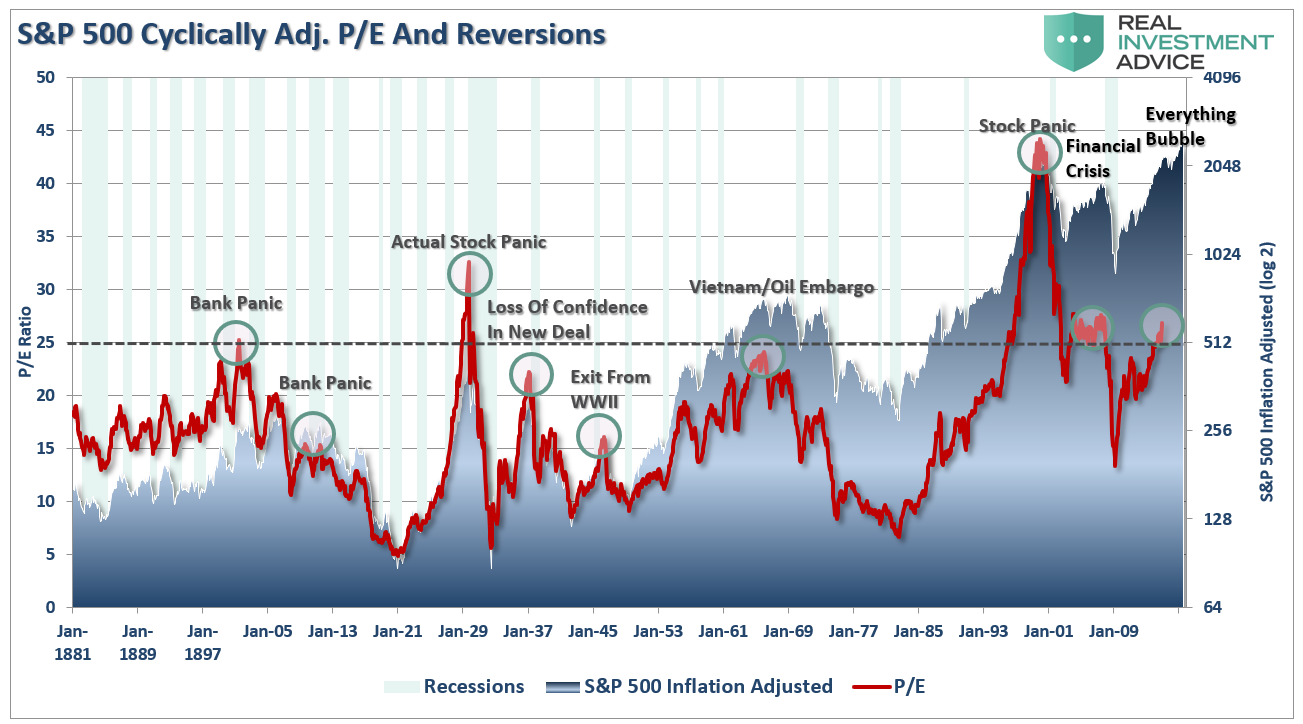
In other words, bubbles can exist even at times when valuations and fundamentals might argue otherwise. Let me show you a very basic example of what I mean. The chart below is the long-term valuation of the S&P 500 going back to 1871.
First, it is important to notice that with the exception of only 1929, 2000 and 2007, every other major market crash occurred with valuations at levels LOWER than they are currently. Secondly, all of these crashes have been the result of things unrelated to valuation levels such as liquidity issues, government actions, monetary policy mistakes, recessions or inflationary spikes. However, those events were only a catalyst, or trigger, that started the “panic for the exits” by investors.
Market crashes are an “emotionally” driven imbalance in supply and demand. You will commonly hear that “for every buyer, there must be a seller.” This is absolutely true. The issue becomes at “what price.” What moves prices up and down, in a normal market environment, is the price level at which a buyer and seller complete a transaction.
In a market crash, however, the number of people wanting to “sell” vastly overwhelms the number of people willing to “buy.” It is at these moments that prices drop precipitously as “sellers” drop the levels at which they are willing to dump their shares in a desperate attempt to find a “buyer.” This has nothing to do with fundamentals. It is strictly an emotional panic which is ultimately reflected by a sharp devaluation in market fundamentals.
Bob Bronson once penned:
“It can be most reasonably assumed that market are sufficient enough that every bubble is significantly different than the previous one, and even all earlier bubbles. In fact, it’s to be expected that a new bubble will always be different than the previous one(s) since investors will only bid up prices to extreme overvaluation levels if they are sure it is not repeating what led to the last, or previous bubbles. Comparing the current extreme overvaluation to the dotcom is intellectually silly.

I would argue that when comparisons to previous bubbles become most popular – like now – it’s a reliable timing marker of the top in a current bubble. As an analogy, no matter how thoroughly a fatal car crash is studied, there will still be other fatal car crashes in the future, even if the previous accident-causing mistakes are avoided.”
He is absolutely right. Comparing the current market bubble to any previous market bubble is rather pointless. Financial markets have already studied and adapted to the causes of the previous “fatal crashes” but this won’t prevent the next one.
I previously discussed George Soros’ theory on bubbles which is worth reviewing at this juncture:
“First, financial markets, far from accurately reflecting all the available knowledge, always provide a distorted view of reality. The degree of distortion may vary from time to time. Sometimes it’s quite insignificant, at other times it is quite pronounced. When there is a significant divergence between market prices and the underlying reality the markets are far from equilibrium conditions.

Every bubble has two components:
  1. An underlying trend that prevails in reality, and; 
  2. A misconception relating to that trend.

When a positive feedback develops between the trend and the misconception, a boom-bust process is set in motion. The process is liable to be tested by negative feedback along the way, and if it is strong enough to survive these tests, both the trend and the misconception will be reinforced. Eventually, market expectations become so far removed from reality that people are forced to recognize that a misconception is involved. A twilight period ensues during which doubts grow, and more people lose faith, but the prevailing trend is sustained by inertia.

As Chuck Prince, former head of Citigroup, said, ‘As long as the music is playing, you’ve got to get up and dance. We are still dancing.’ Eventually, a tipping point is reached when the trend is reversed; it then becomes self-reinforcing in the opposite direction.”
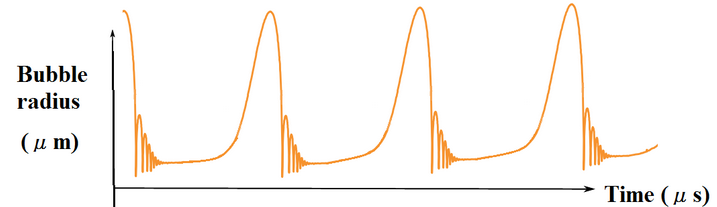
Typically bubbles have an asymmetric shape. The boom is long and slow to start. It accelerates gradually until it flattens out again during the twilight period. The bust is short and steep because it involves the forced liquidation of unsound positions.
The chart below is an example of asymmetric bubbles.
The pattern of bubbles is interesting because it changes the argument from a fundamental view to a technical view. Prices reflect the psychology of the market which can create a feedback loop between the markets and fundamentals.
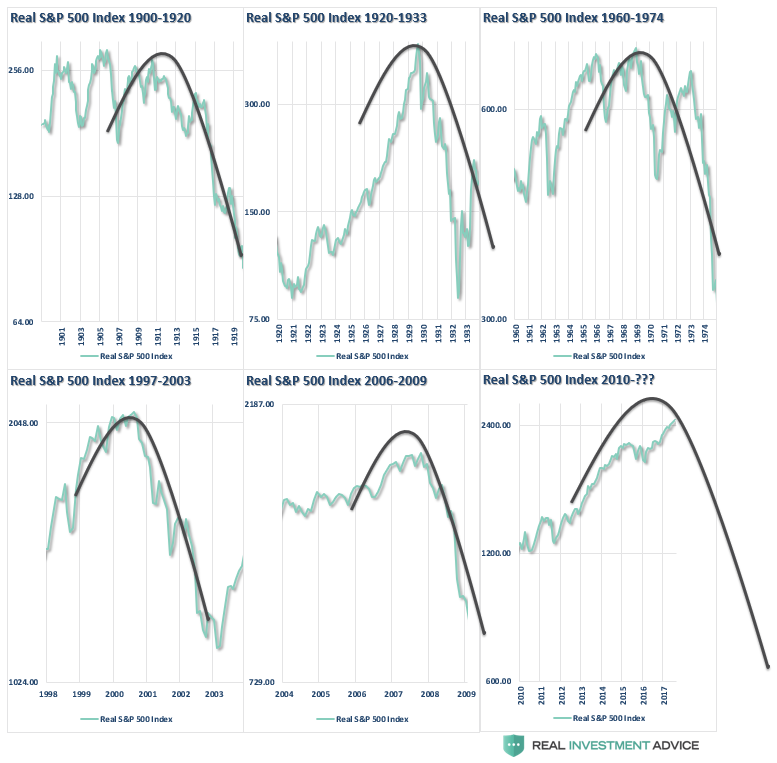
This pattern of bubbles can be clearly seen at every bull market peak in history. The chart below utilizes Dr. Robert Shiller’s stock market data going back to 1900 on an inflation-adjusted basis with an overlay of the asymmetrical bubble shape.
There is currently a strong belief that the financial markets are not in a bubble. The arguments supporting those beliefs are all based on comparisons to past market bubbles.
The inherent problem with much of the mainstream analysis is that it assumes everything remains status quo. However, the question becomes what can go wrong for the market?
In a word, “much.”
Economic growth remains very elusive, corporate profits appear to have peaked, and there is an overwhelming complacency with regards to risk. Those ingredients combined with an extraction of liquidity by the Federal Reserve leaves the markets more vulnerable to an exogenous event than currently believed.
It is likely that in a world where there is virtually “no fear” of a market correction, an overwhelming sense of “urgency” to be invested and a continual drone of “bullish chatter;” markets are poised for the unexpected, unanticipated and inevitable reversion.
As Chris Martenson recently penned:
“I hate to break it to you, but chances are you’re just not prepared for what’s coming.

These bubbles – blown by central bankers serially addicted to creating them (and then riding to the rescue to fix them) – are the largest in all of history. That means they’re going to be the most destructive in history when they finally let go.

Millions of households will lose trillions of dollars in net worth. Jobs will evaporate, causing the tens of millions of families living paycheck to paycheck serious harm.

These are the kind of painful consequences central bank follies result in. They’re particularly regrettable because they could have been completely avoided if only we’d taken our medicine during the last crisis back in 2008.  But we didn’t. We let the Federal Reserve –the institution largely responsible for creating the Great Financial Crisis — conspire with its brethren central banks to ‘paper over’ our problems.
So now we are at the apex of the most incredible nest of financial bubbles in all of human history.”
I am not trying to scare the “bejeebers” out of you, but he is right.
“All financial assets are just claims on real wealth, not actual wealth itself.  A pile of money has use and utility because you can buy stuff with it.  But real wealth is the “stuff” — food, clothes, land, oil, and so forth.  If you couldn’t buy anything with your money/stocks/bonds, their worth would revert to the value of the paper they’re printed on (if you’re lucky enough to hold an actual certificate). It’s that simple.

But trouble begins when the system gets seriously out of whack.

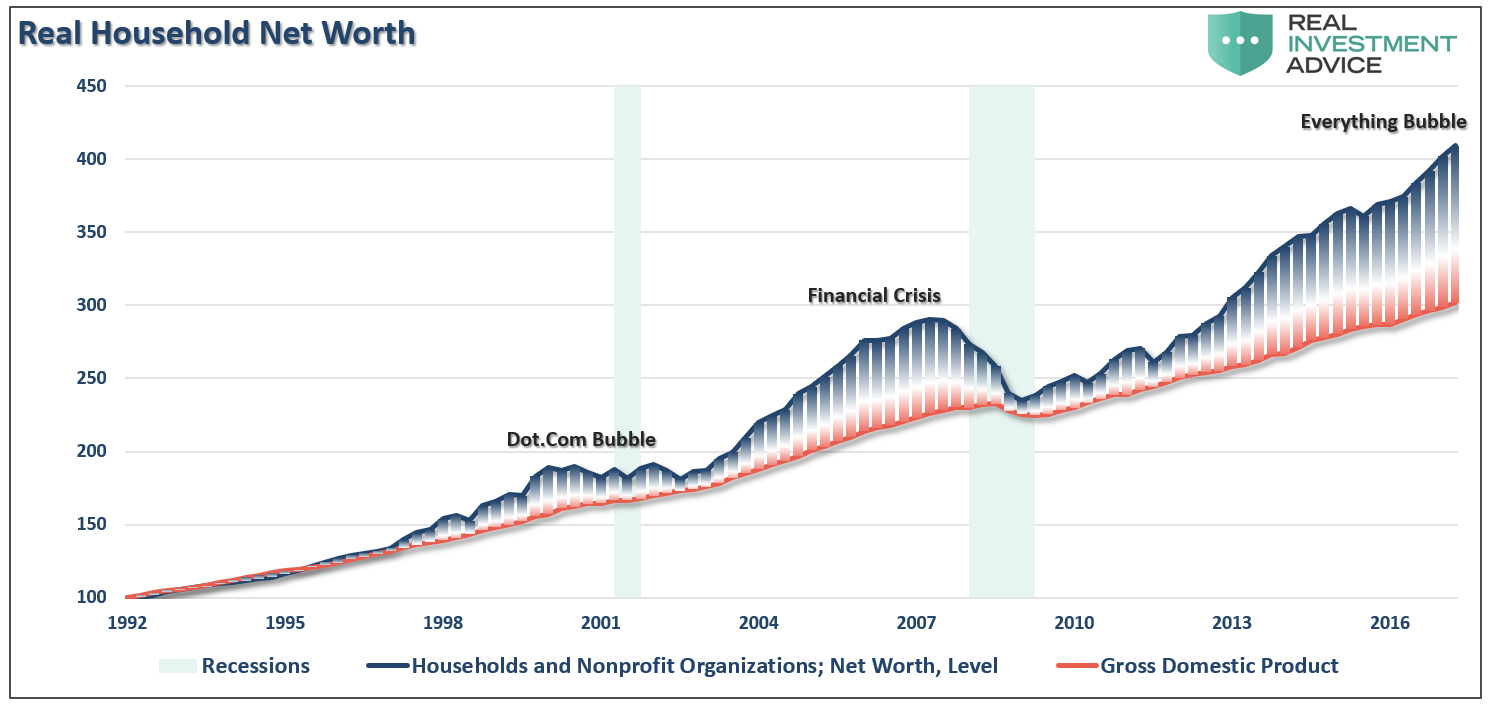
‘GDP’ is a measure of the number of goods and services available and financial asset prices represent the claims (it’s not a very accurate measure of real wealth, but it’s the best one we’ve got, so we’ll use it). Look at how divergent asset prices get from GDP as bubbles develop.
“What we see in the above chart is that the claims on the economy should, quite intuitively, track the economy itself.  Bubbles occurred whenever the claims on the economy, the so-called financial assets (stocks, bonds, and derivatives), get too far ahead of the economy itself.

This is a very important point. The claims on the economy are just that: claims.  They are not the economy itself!”
Take a step back from the media, and Wall Street commentary, for a moment and make an honest assessment of the financial markets today. If our job is to “bet” when the “odds” of winning are in our favor, then exactly how “strong” is the fundamental hand you are currently betting on?
This “time IS different” only from the standpoint that the variables are not exactly the same as they have been previously. Of course, they never are, and the result will be “…the same as it ever was.”