9 dicembre forconi: Robert Shiller
Visualizzazione post con etichetta Robert Shiller. Mostra tutti i post

domenica 16 settembre 2018

Robert Shiller: Look For One Final Surge In Stocks Before The Crash

It seems like only yesterday that Robert Shiller, a Nobel-Prize winning economist (and esteemed member of the Yale School of Management's faculty), was telling anybody who would listen that the US equity market was headed for a vertigo-inducing correction.
But with stocks once again hovering near record highs, it seems that Shiller - the co-creator of the Shiller P/E ratio - has become the latest CNBC stalwart to throw in the towel. While sell-side banks (most recently SocGen) are increasingly focusing on the fallout from the Trump trade war, Shiller has pivoted to an analysis of other Trump economic policies like the Trump tax cuts and his rollbacks of regulation, which, taken together, have provided an unprecedented level of support to corporate America, per Bloomberg.
While he once lambasted President Trump as "totally unbecoming and unfit", Shiller demonstrated a newfound reverence for Trump and his policies during his latest interview (we can only imagine why).
Shiller’s focus instead is on President Donald Trump’s support for corporate America, which he says is driving sentiment and market strength. The S&P 500 Index has climbed almost 9 percent this year, with the total return to investors running at an annual rate of more than 14 percent. It closed Thursday less than 0.5 percent from its August record high.
"It has something to do with our president, who is an exceptionally business-oriented president and who wants to deregulate and favors lower taxes," he said. "That has an effect on the market but it goes beyond the rational, logical effect - it has something to do with our animal spirits. The U.S. is just doing great right now in terms of the strength of the economy and the stock market. That seems to be built around the Trump story at this point in history."
And while the economist raised a stink last year as his vaunted Shiller P/E index surpassed its pre-crisis levels, the Yale professor is now using the tech boom (when companies' near-$0 earnings caused the ratio to blow out to unprecedented levels) as his preferred reference point.
"The stock market could get a lot higher before it comes down. It’s highly priced, but it could get much more highly priced. It’s a risky market now," Shiller told Bloomberg Television on Thursday.
Shiller
Indeed, while valuations may be stretched by historical standards, by the standards of the tech boom, today's valuations appear far less precarious.
Valuations may be among the most extreme in long-term history, but Shiller highlighted that they’re still well below the heady days of the technology boom at the turn of the century. The cyclically adjusted price-to-earnings ratio, which Shiller popularized to smooth out the effect of earnings over the longer run, currently sits at 33 times earnings. It reached as high as 44 in 2000, just before the dot-com crash.
Shiller
However, a historical analysis of equity performance during the years leading up to the 1929 crash paints a dimmer picture...
Shiller
Readers should take all of the above with a grain of salt: last year, Shiller famously declared that he had trimmed his allocation to US equities and instead added to positions in foreign equities. Of course, anybody who has been keeping track of this year's astonishing upside divergence, knows how well that worked out.
Fonte: qui

giovedì 7 dicembre 2017

This Time Is Different, It Just Ends The Same

This past weekend, I was in Florida with Chris Martenson and Nomi Prins discussing the current backdrop of the markets, economic cycles, and future outcomes. A bulk of the conversations centered around the current “everything bubble” that currently exists globally. Elevated valuations in stock prices, extremely low yields between in “junk bonds,” or intense speculation around “cryptocurrencies” all suggest we have entered once again into “bubble” territory.”
Let me state this:
“Market bubbles have NOTHING to do with valuations or fundamentals.”
Hold on…don’t start screaming “heretic” and building gallows just yet. Let me explain.
Stock market bubbles are driven by speculation, greed, and emotional biases – therefore valuations and fundamentals are simply a reflection of those emotions.
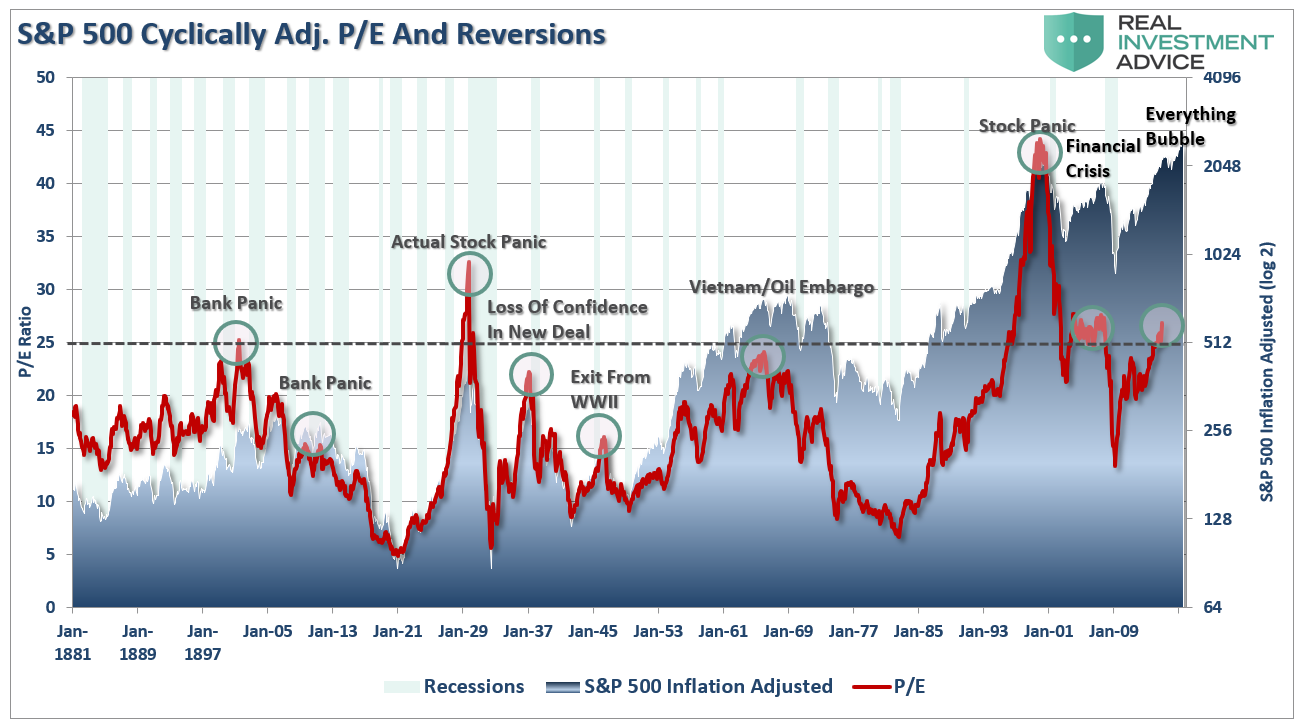
In other words, bubbles can exist even at times when valuations and fundamentals might argue otherwise. Let me show you a very basic example of what I mean. The chart below is the long-term valuation of the S&P 500 going back to 1871.
First, it is important to notice that with the exception of only 1929, 2000 and 2007, every other major market crash occurred with valuations at levels LOWER than they are currently. Secondly, all of these crashes have been the result of things unrelated to valuation levels such as liquidity issues, government actions, monetary policy mistakes, recessions or inflationary spikes. However, those events were only a catalyst, or trigger, that started the “panic for the exits” by investors.
Market crashes are an “emotionally” driven imbalance in supply and demand. You will commonly hear that “for every buyer, there must be a seller.” This is absolutely true. The issue becomes at “what price.” What moves prices up and down, in a normal market environment, is the price level at which a buyer and seller complete a transaction.
In a market crash, however, the number of people wanting to “sell” vastly overwhelms the number of people willing to “buy.” It is at these moments that prices drop precipitously as “sellers” drop the levels at which they are willing to dump their shares in a desperate attempt to find a “buyer.” This has nothing to do with fundamentals. It is strictly an emotional panic which is ultimately reflected by a sharp devaluation in market fundamentals.
Bob Bronson once penned:
“It can be most reasonably assumed that market are sufficient enough that every bubble is significantly different than the previous one, and even all earlier bubbles. In fact, it’s to be expected that a new bubble will always be different than the previous one(s) since investors will only bid up prices to extreme overvaluation levels if they are sure it is not repeating what led to the last, or previous bubbles. Comparing the current extreme overvaluation to the dotcom is intellectually silly.

I would argue that when comparisons to previous bubbles become most popular – like now – it’s a reliable timing marker of the top in a current bubble. As an analogy, no matter how thoroughly a fatal car crash is studied, there will still be other fatal car crashes in the future, even if the previous accident-causing mistakes are avoided.”
He is absolutely right. Comparing the current market bubble to any previous market bubble is rather pointless. Financial markets have already studied and adapted to the causes of the previous “fatal crashes” but this won’t prevent the next one.
I previously discussed George Soros’ theory on bubbles which is worth reviewing at this juncture:
“First, financial markets, far from accurately reflecting all the available knowledge, always provide a distorted view of reality. The degree of distortion may vary from time to time. Sometimes it’s quite insignificant, at other times it is quite pronounced. When there is a significant divergence between market prices and the underlying reality the markets are far from equilibrium conditions.

Every bubble has two components:
  1. An underlying trend that prevails in reality, and; 
  2. A misconception relating to that trend.

When a positive feedback develops between the trend and the misconception, a boom-bust process is set in motion. The process is liable to be tested by negative feedback along the way, and if it is strong enough to survive these tests, both the trend and the misconception will be reinforced. Eventually, market expectations become so far removed from reality that people are forced to recognize that a misconception is involved. A twilight period ensues during which doubts grow, and more people lose faith, but the prevailing trend is sustained by inertia.

As Chuck Prince, former head of Citigroup, said, ‘As long as the music is playing, you’ve got to get up and dance. We are still dancing.’ Eventually, a tipping point is reached when the trend is reversed; it then becomes self-reinforcing in the opposite direction.”
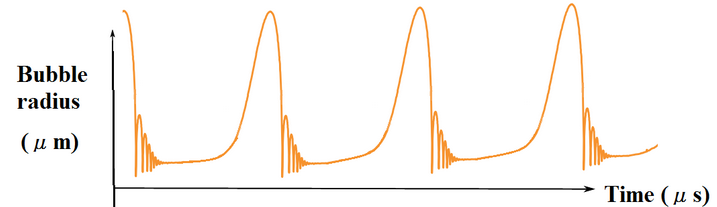
Typically bubbles have an asymmetric shape. The boom is long and slow to start. It accelerates gradually until it flattens out again during the twilight period. The bust is short and steep because it involves the forced liquidation of unsound positions.
The chart below is an example of asymmetric bubbles.
The pattern of bubbles is interesting because it changes the argument from a fundamental view to a technical view. Prices reflect the psychology of the market which can create a feedback loop between the markets and fundamentals.
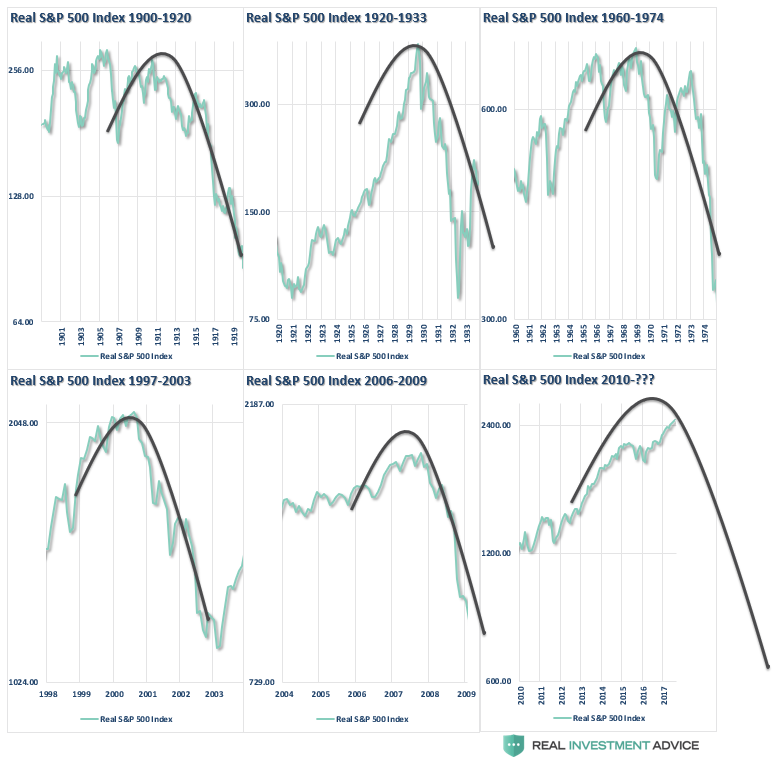
This pattern of bubbles can be clearly seen at every bull market peak in history. The chart below utilizes Dr. Robert Shiller’s stock market data going back to 1900 on an inflation-adjusted basis with an overlay of the asymmetrical bubble shape.
There is currently a strong belief that the financial markets are not in a bubble. The arguments supporting those beliefs are all based on comparisons to past market bubbles.
The inherent problem with much of the mainstream analysis is that it assumes everything remains status quo. However, the question becomes what can go wrong for the market?
In a word, “much.”
Economic growth remains very elusive, corporate profits appear to have peaked, and there is an overwhelming complacency with regards to risk. Those ingredients combined with an extraction of liquidity by the Federal Reserve leaves the markets more vulnerable to an exogenous event than currently believed.
It is likely that in a world where there is virtually “no fear” of a market correction, an overwhelming sense of “urgency” to be invested and a continual drone of “bullish chatter;” markets are poised for the unexpected, unanticipated and inevitable reversion.
As Chris Martenson recently penned:
“I hate to break it to you, but chances are you’re just not prepared for what’s coming.

These bubbles – blown by central bankers serially addicted to creating them (and then riding to the rescue to fix them) – are the largest in all of history. That means they’re going to be the most destructive in history when they finally let go.

Millions of households will lose trillions of dollars in net worth. Jobs will evaporate, causing the tens of millions of families living paycheck to paycheck serious harm.

These are the kind of painful consequences central bank follies result in. They’re particularly regrettable because they could have been completely avoided if only we’d taken our medicine during the last crisis back in 2008.  But we didn’t. We let the Federal Reserve –the institution largely responsible for creating the Great Financial Crisis — conspire with its brethren central banks to ‘paper over’ our problems.
So now we are at the apex of the most incredible nest of financial bubbles in all of human history.”
I am not trying to scare the “bejeebers” out of you, but he is right.
“All financial assets are just claims on real wealth, not actual wealth itself.  A pile of money has use and utility because you can buy stuff with it.  But real wealth is the “stuff” — food, clothes, land, oil, and so forth.  If you couldn’t buy anything with your money/stocks/bonds, their worth would revert to the value of the paper they’re printed on (if you’re lucky enough to hold an actual certificate). It’s that simple.

But trouble begins when the system gets seriously out of whack.

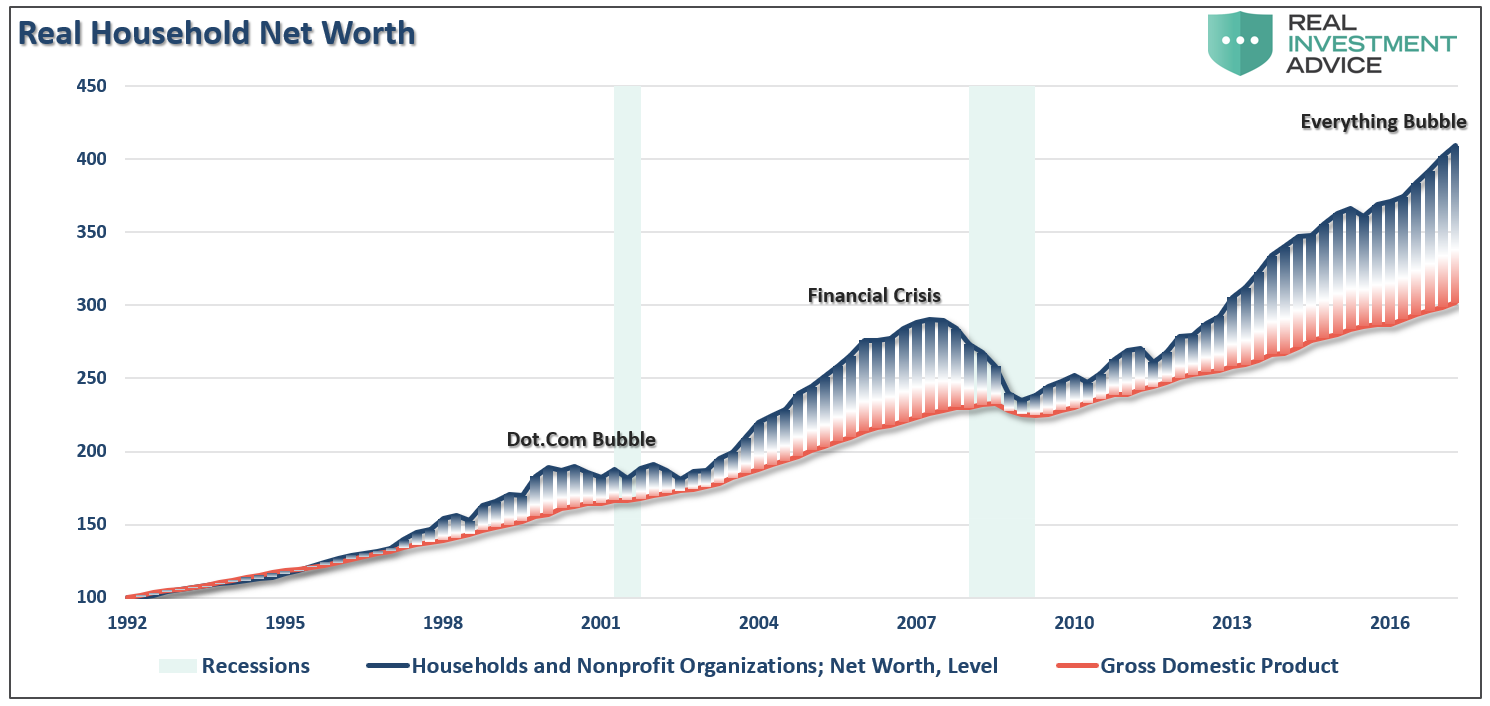
‘GDP’ is a measure of the number of goods and services available and financial asset prices represent the claims (it’s not a very accurate measure of real wealth, but it’s the best one we’ve got, so we’ll use it). Look at how divergent asset prices get from GDP as bubbles develop.
“What we see in the above chart is that the claims on the economy should, quite intuitively, track the economy itself.  Bubbles occurred whenever the claims on the economy, the so-called financial assets (stocks, bonds, and derivatives), get too far ahead of the economy itself.

This is a very important point. The claims on the economy are just that: claims.  They are not the economy itself!”
Take a step back from the media, and Wall Street commentary, for a moment and make an honest assessment of the financial markets today. If our job is to “bet” when the “odds” of winning are in our favor, then exactly how “strong” is the fundamental hand you are currently betting on?
This “time IS different” only from the standpoint that the variables are not exactly the same as they have been previously. Of course, they never are, and the result will be “…the same as it ever was.”

venerdì 17 novembre 2017

It's A 'Turkey' Market

With Thanksgiving week rapidly approaching, I thought it was an apropos time to discuss what I am now calling a “Turkey” market.
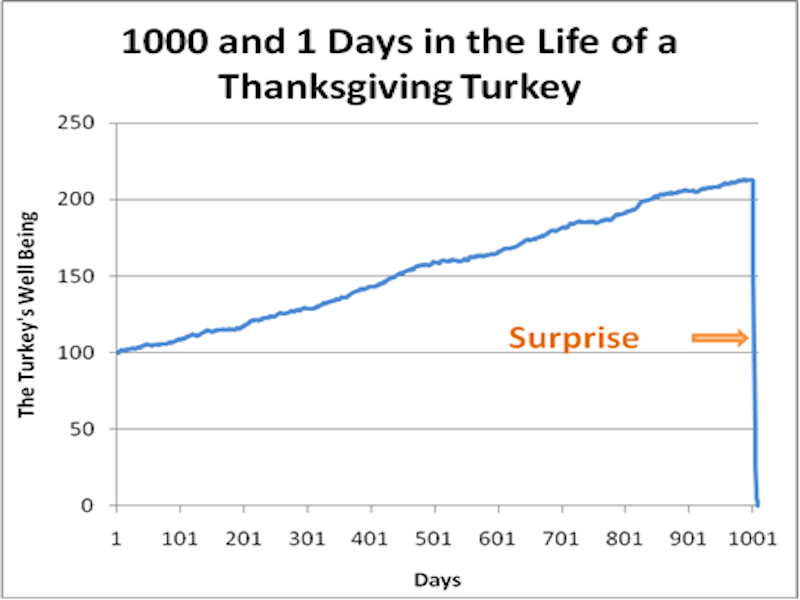
What’s a “Turkey” market?  Nassim Taleb summed it up well in his 2007 book “The Black Swan.”
“Consider a turkey that is fed every day. Every single feeding will firm up the bird’s belief that it is the general rule of life to be fed every day by friendly members of the human race ‘looking out for its best interests,’ as a politician would say.

On the afternoon of the Wednesday before Thanksgiving, something unexpected will happen to the turkey. It will incur a revision of belief.”
Such is the market we live in currently.
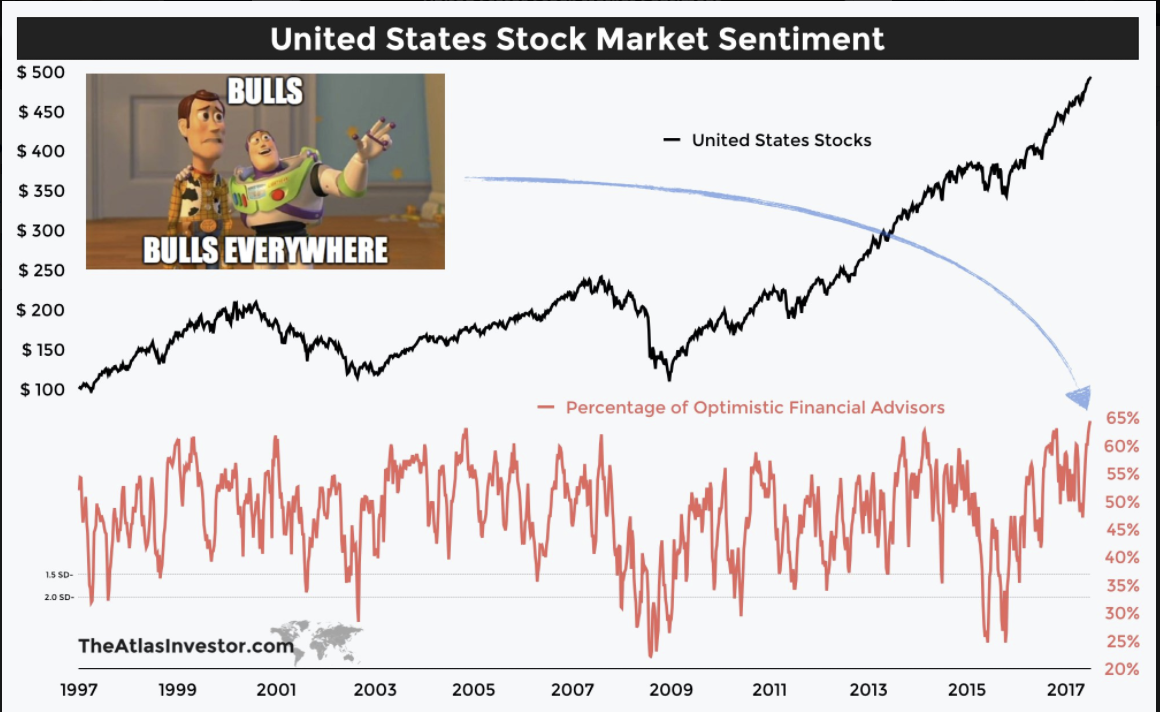
In a market that is excessively bullish and overly complacent, investors are “willfully blind” to the relevant “risks” of excessive equity exposure. The level of bullishness, by many measures, is extremely optimistic, as this chart from Tiho Krkan (@Tihobrkan) shows.
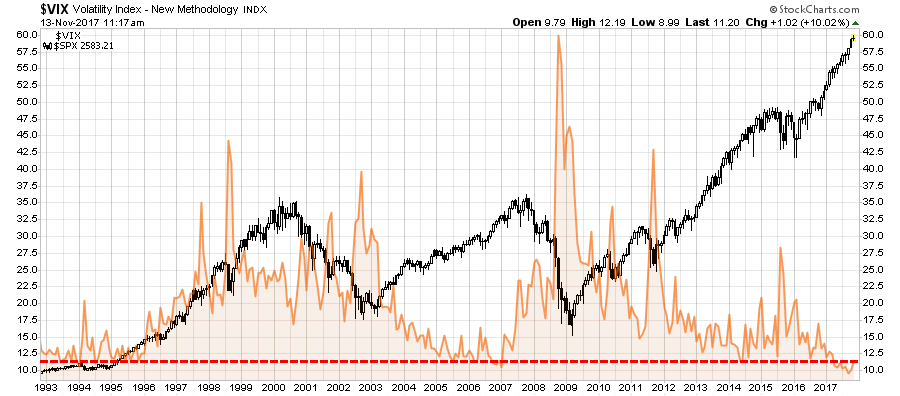
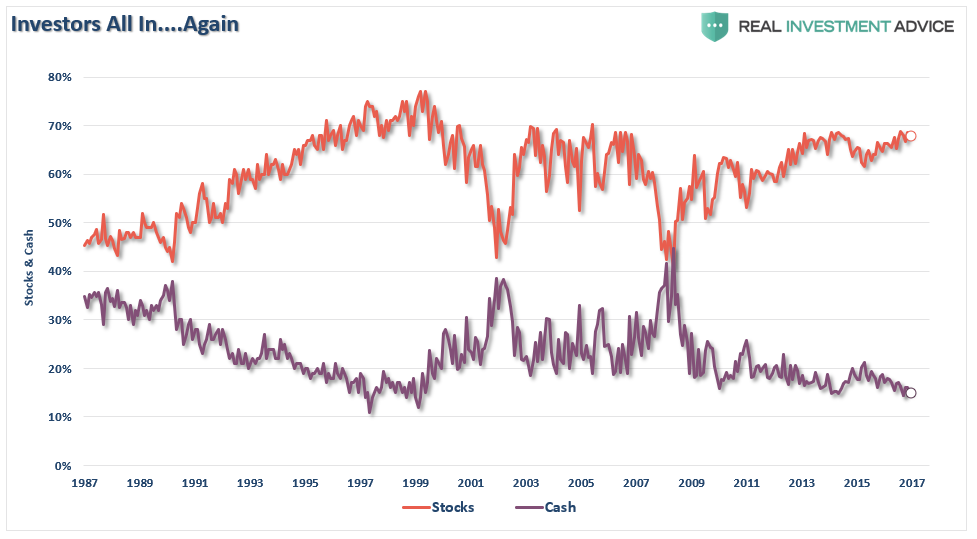
Not surprisingly, that extreme level of bullishness has led to some of the lowest levels of volatility and cash allocations in market history.
Of course, you can’t have a “Turkey” market unless you are being lulled into it with a supporting story that fits the overall narrative. The story of “it’s an earnings-driven market” is one such narrative. As noted  by my friend Doug Kass:
“Earnings are there to support the market. If we didn’t have earnings to support the market, that would be worrying. But we have earnings.”
—Mary Ann Bartels, Merrill Lynch Wealth Management


“Earnings are doing remarkably well.”
—Ed Yardeni, Yardeni Research


“This is very much an earnings-driven market.”
—Paul Springmeyer, U.S. Bancorp Private Wealth Management


“This is very much earnings-driven.”
—Michael Shaoul, Marketfield Asset Management


“Equities have largely been driven by global liquidity, but they are now being driven by earnings.”
—Kevin Boscher, Brooks Macdonald International


“Most of the market action in 2017 has been earning-driven.”
—Dan Chung, Alger Management


“The action is justified because of earnings.“
—James Liu, Clearnomics


In another case of “Group Stink” and contrary to the pablum we hear from many of the business media’s talking heads, the U.S. stock market has not been an earnings-driven story in 2017. (I have included seven “earnings-driven” quotes above from recent interviews on CNBC, but there are literally hundreds of these interviews, all saying the same thing)

Rather, it has been a valuation-driven story, just as it was in 2016 when S&P 500 profits were up 5% and the S&P Index rose by about 11%. And going back even further, since 2012 S&P earnings have risen by 30% compared to an 80% rise in the price of the S&P lndex!
He is absolutely right, of course, as I examined in the drivers of the market rally three weeks ago.
“The chart below expands that analysis to include four measures combined: Economic growth, Top-line Sales Growth, Reported Earnings, and Corporate Profits After Tax. While quarterly data is not yet available for the 3rd quarter, officially, what is shown is the market has grown substantially faster than all other measures. Since 2014, the economy has only grown by a little less than 9%, top-line revenues by just 3% along with corporate profits after tax, and reported earnings by just 2%. All of that while asset prices have grown by 29% through Q2.” 
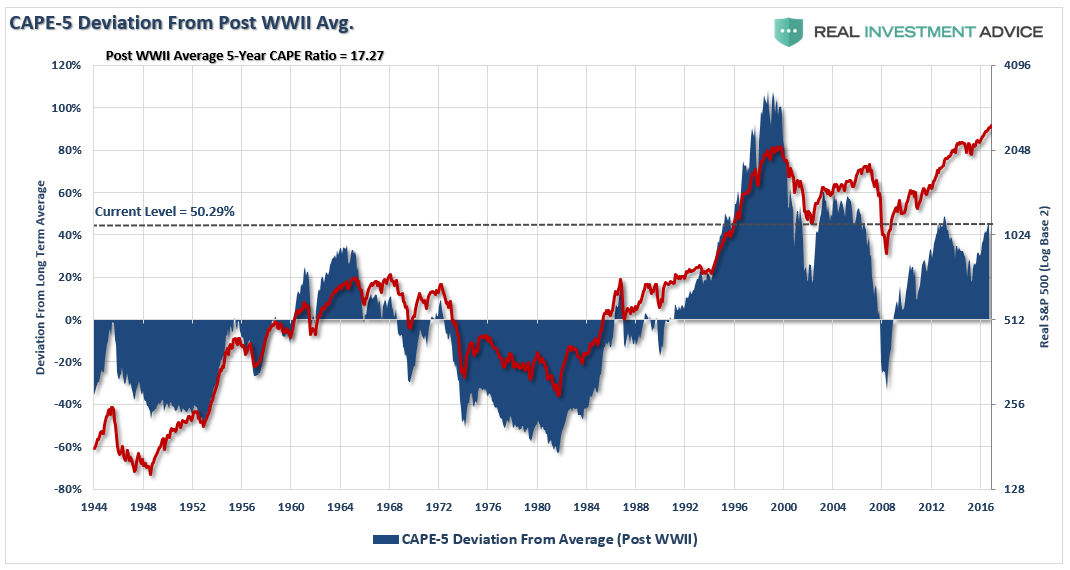
The hallmark of a “Turkey” market really comes down to the detachment of price from valuation and the deviation of price from long-term norms. Both of these detachments are shown in the charts below.
CAPE-5 is a modified version of Dr. Robert Shiller’s smoothed 10-year average. By using a 5-year average of CAPE (Cyclically Adjusted Price Earnings) ratio, it becomes more sensitive to market movements. Historically, deviations above 40% have preceded secular bear markets, while deviations exceeding -40% preceded secular bull markets.
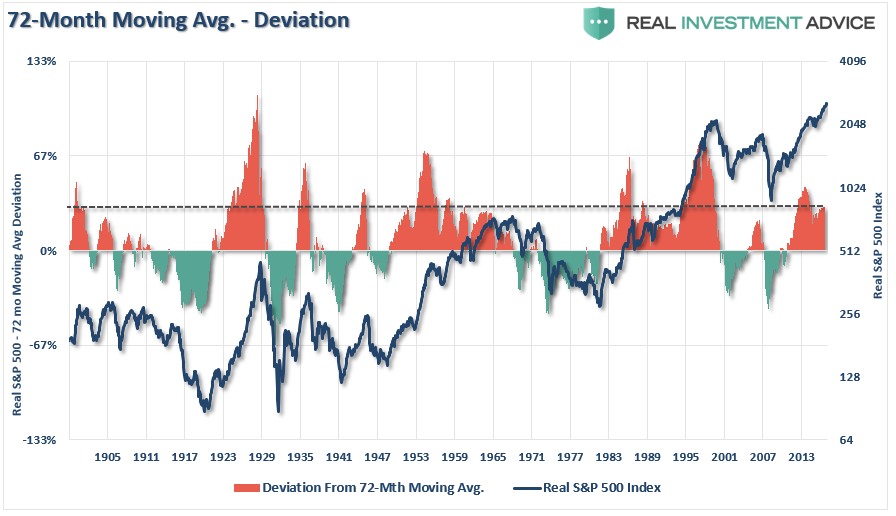
The next chart shows the deviation of the real, inflation-adjusted S&P 500 index from the 6-year (72-month) moving average.
Not surprisingly, when the price of the index has deviated significantly from the underlying long-term moving averages, corrections and bear markets have not been too distant.
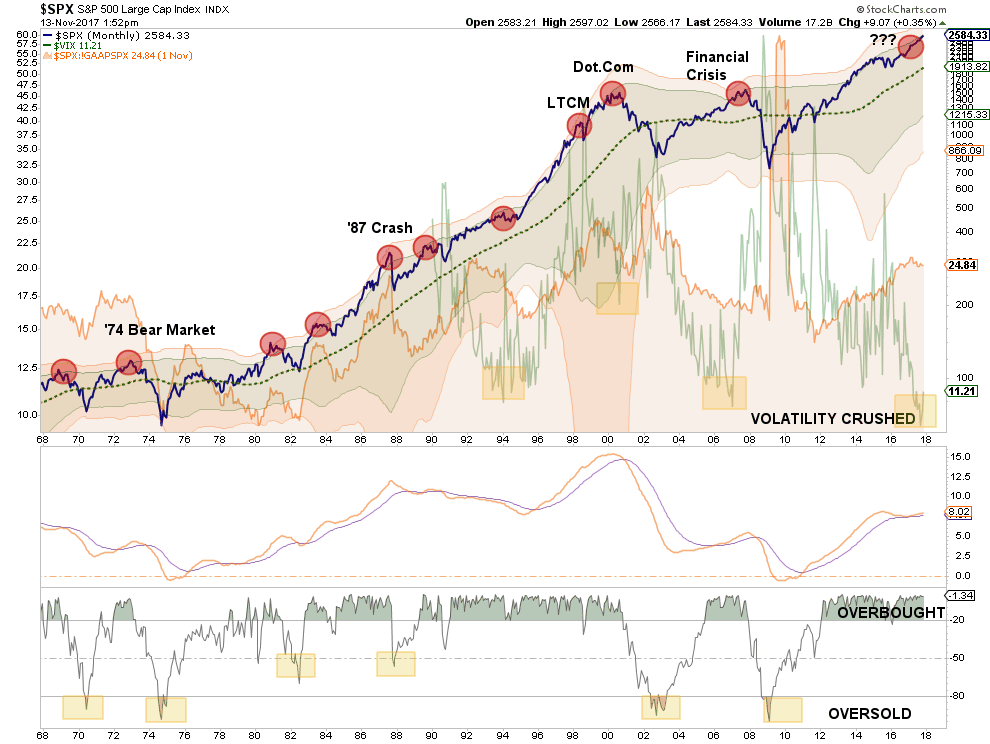
Combining the above measures (volatility, valuation, and deviation) together shows this a bit more clearly. The chart shows both 2 and 3-standard deviations above the 6-year moving average. The red circles denote periods where valuations, complacency and 3-standard deviation moves have converged. 
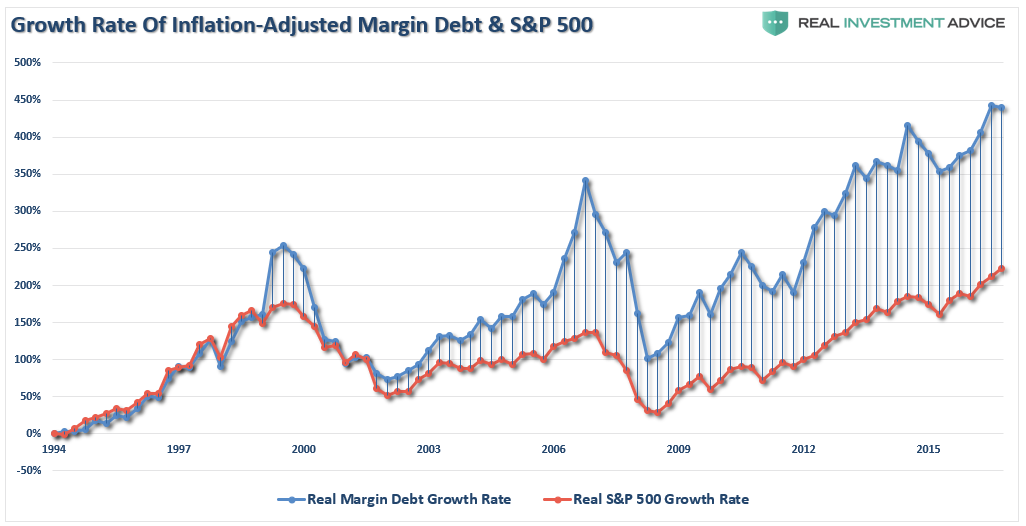
Of course, with cash balances low, you can’t foster that kind of extension without sufficiently increasing leverage in the overall system. The expansion of margin debt is a good proxy for the “fuel” driving the bull market advance.
Naturally, as long as that “fuel” isn’t ignited, leverage can remain supportive of the market’s advance. However, when the reversion begins, the “fuel” that drove stocks higher will “explode” when selling forces liquidation through margin calls.
While the media continues to suggest the markets are free from risk, and investors should go ahead and “stick-their-necks-out,” history shows that periods of low volatility, high valuations and deviations from long-term means has resulted in very poor outcomes.
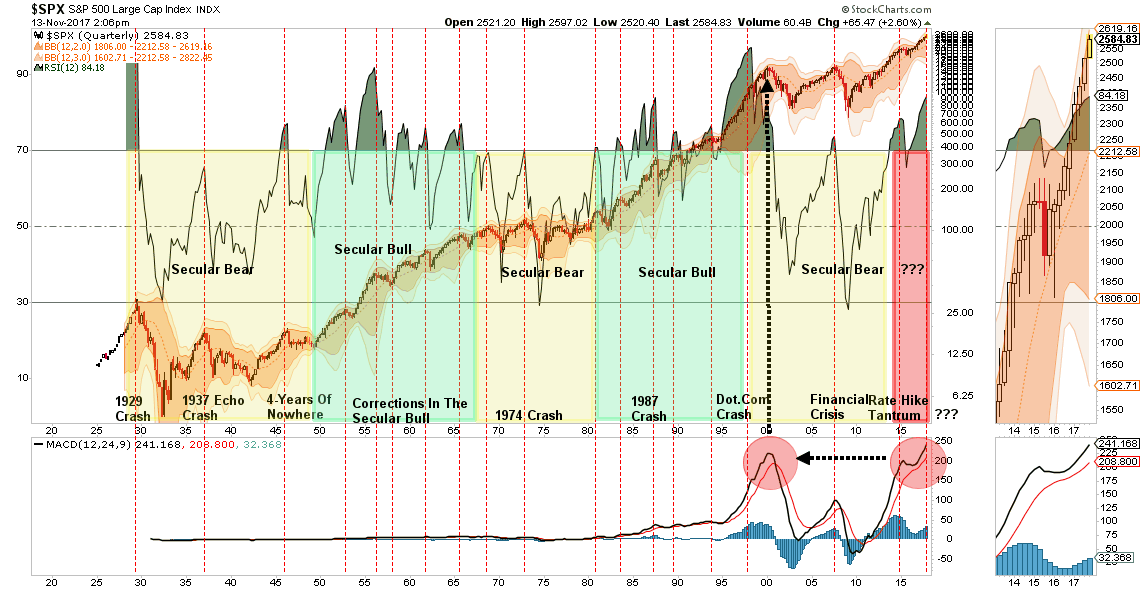
Lastly, there has been a lot of talk about how markets have entered into a new “secular bull market” period. As I have addressed previously, I am not sure such is the case. Given the debt, demographic and deflationary backdrop, combined with the massive monetary interventions of global Central Banks, it is entirely conceivable the current advance remains part of the secular bear market that began at the turn of the century.
Only time will tell.
Regardless, whether this is a bull market rally in an ongoing bear market, OR a bull rally in a new bull market, whenever the RSI (relative strength index) on a 3-year basis has risen above 70 it has usually marked the end of the current advance. Currently, at 84, there is little doubt the market has gotten ahead of itself.
No matter how you look at it, the risk to forward returns greatly outweighs the reward presently available.
Importantly, this doesn’t mean that you should “sell everything” and go hide in cash, but it does mean that being aggressively exposed to the financial markets is no longer opportune.
What is clear is that this is no longer a “bull market.”
It has clearly become a “Turkey” market. Unfortunately, like Turkeys, we really have no clue where we are on the current calendar. We only know that today is much like yesterday, and the “bliss” of calm and stable markets have lulled us into extreme complacency.
You can try and fool yourself that weak earnings growth, low interest rates and high-valuations are somehow are justified. The reality is, like Turkeys, we will ultimately be sadly mistaken and learn a costly lesson.
“Price is what you pay, Value is what you get.” – Warren Buffett
Authored by Lance Roberts via RealInvestmentAdvice.com,