9 dicembre forconi: Warren Buffett
Visualizzazione post con etichetta Warren Buffett. Mostra tutti i post

martedì 7 agosto 2018

Buffett's Favorite Indicator Exposes A Stock Market More Primed For A Crash Than Ever Before

Warren Buffett’s favorite indicator is telling us that stocks are more overvalued right now than they have ever been before in American history. 
That doesn’t mean that a stock market crash is imminent.  In fact, this indicator has been in the “danger zone” for quite some time.  But what it does tell us is that stock valuations are more bloated than we have ever seen and that a stock market crash would make perfect sense. 
So precisely what is the “Buffett Indicator”?  Well, it is actually very simple to calculate.  You just take the total market value of all stocks and divide it by the gross domestic product.  When that ratio is more than 100 percent, stocks are generally considered to be overvalued, and when that ratio is under 100 percent stocks are generally considered to be undervalued.  The following comes from MSN…
That being said, the Buffett Indicator, while it’s not a flawless indicator, does tend to peak during hot stock markets and bottom during weak markets. And as a general rule, if the indicator falls below 80%-90% or so, it has historically signaled that stocks are cheap. On the other hand, levels significantly higher than 100% can indicate stocks are expensive.
For context, the Buffett indicator peaked at about 145% right before the dot-com bubble burst and reached nearly 110% before the financial crisis.
So where are we today?
Right now we are at almost 149 percent, which is the highest level ever recorded…
Where does the Buffett Indicator stand now? It may surprise you to learn that, at nearly 149%, the total market cap to GDP ratio has never been higher. It’s even higher than the 145% peak we saw during the dot-com bubble.
In recent days we have seen a “tech bloodbath”, but that was nothing compared to what is eventually coming.  Ultimately, the stock market would need to fall by at least one-third in order for prices to be properly balanced again.
And it appears that Warren Buffett is taking his own advice.  His company is currently sitting on more than 100 billion dollars in cash…
Having said that, it does seem like Buffett himself is paying attention and agrees that the market is generally expensive. After all, the lack of attractive investment opportunities has resulted in Berkshire Hathaway accumulating nearly $110 billion of cash and equivalents on its balance sheet. Plus, Buffett has specifically cited valuation when discussing the absence of major acquisitions lately.
Warren Buffett didn’t become one of the wealthiest men in America by being stupid.  He knows that valuations are absurd right now, and he is waiting to strike until valuations are not so absurd.
And he knows that another recession is inevitably coming.  I wrote about some of the trouble signs yesterday, and more trouble signs seem to pop up on a daily basis now.
Earlier today, CNN published an article entitled “Two recession warning signs are here”…
Home sales have declined in four of the past five months as housing prices have grown — but paychecks have remained stagnant. Many people can’t afford to buy homes, and those who can are taking on a lot of debt to get into them.
I feel really bad for those that purchased a home in recent months, because those poor people are getting in right at the top of the bubble.  The housing bubble is about to burst in a major way, and there will be a tremendous amount of pain afterwards.
And we received more bad news about the housing market on Wednesday.  According to Redfin, housing demand plunged 9.6 percent in June…
The long list of housing headwinds is finally taking its toll on potential buyers. Housing demand fell 9.6 percent in June, compared with June 2017, according to a monthly index from Redfin. That is the largest decline since April 2016.
CNN’s second “warning sign” is the fact that the yield curve is about to invert…
The Federal Reserve, which is finishing up its two-day meeting Wednesday, is expected to raise its target rate two more times this year. Higher rates have boosted short-term US Treasury bond rates. But the longer-term bond rates haven’t risen along with the shorter-term rates, because investors are growing wary about the economy over the long haul.
With two more interest rate hikes planned, the Fed could boost short-term rates higher than long-term ones, inverting the so-called yield curve. An inverted yield curve has preceded every recession in modern history.
If you don’t understand the yield curve or you just want a deeper examination of this issue, please see my previous article entitled “Beware – The Last 7 Times The Yield Curve Inverted The U.S. Economy Was Hit By A Recession”.
In recent weeks, there has been renewed interest in my economics website as people begin to wake up and understand that a major economic crisis is looming.  Of course the truth is that we are way, way overdue for a stock market crash and another recession.  The only thing that is surprising is that it took us so long to get here.
Sadly, most people are still very much asleep.  Average Americans spend most of their waking hours staring at either a television or a computer screen, and the big media companies control almost all of the media that we are so voraciously consuming.  Instead of thinking for themselves, most people simply regurgitate what they have been fed by the media giants, and we are never going to turn things around if we continue to allow “the matrix” to tell us what to think.
The Buffett Indicator is very simple, but it is also very accurate.  If you want to do well in the stock market, you want to buy low and sell high, and right now we are in absurdly high territory.  Stock valuations always return to their long-term averages eventually, and many believe that the coming stock market crash is going to arrive sooner rather than later.

martedì 26 dicembre 2017

Perché Warren Buffett non investe in bitcoin e in oro?

L’investitore più famoso al mondo Warren Buffett ha deciso di non investire né in bitcoin né in oro. Come mai?

Warren Buffett è il terzo uomo più ricco del mondo con un patrimonio di 75,6 miliardi di dollari. Egli fece la sua fortuna principalmente grazie agli investimenti finanziari, leggendaria è la sua capacità in questo campo, che gli è valso il soprannome di “Oracolo di Omaha”. Ha deciso, però, di non investire né in bitcoin né in oro, scopriamone le motivazioni.

Warren Buffet non investe in Bitcoin

Warren Buffett non investe in criptovalute e non ha quindi partecipato alla grande scalata del Bitcoin, la cui quotazione ha sfiorato recentemente quota 20.000 dollari, non credendo nelle potenzialità delle monete digitali.
Secondo l’Oracolo di Omaha il Bitcoin è un asset che non produce valoreed è dunque impossibile prevedere il suo andamento futuro. Per questa ragione la definisce una bolla sulla quale non è una buona idea investire.
Nel marzo del 2014 Warren Buffet spiegò inoltre che l’enorme valore intrinseco che ha accumulato il bitcoin doveva essere solo uno scherzo, a suo avviso, dato che il bitcoin è un metodo di trasmissione di denaro, come gli assegni. Possono quindi gli assegni apprezzarsi solo perché permettono transazioni di denaro? Questa è sostanzialmente la domanda che si poneva Buffet.

Warren Buffet non investe sull’oro

Per capire meglio il punto di vista di Warren Buffett sul bitcoin spieghiamo il motivo che lo ha portato negli anni a non voler investire sull’oro.
Il motivo principale resta lo stesso: l’oro non produce nulla. Buffet ammette che un piccolo utilizzo dell’oro esiste, per esempio ha un’utilità industriale e decorativa, che però è limitata ed incapace di assorbire la produzione.
L’Oracolo di Omaha sostiene che l’oro è un asset proprio come lo furono i tulipani nel 17° secolo, ovvero non ha nessuna utilità. Per Warren Buffet anche l’oro è una bolla e acquista valore solo perché gli investitori credono che l’oro ne abbia e quindi continuano a immettere denaro su questa materia prima.
È il cosiddetto “effetto carrozzone”, ovvero quando la gente fa una determinata cosa solo perché la maggioranza delle persone la sta facendo.
Secondo Buffet è l’istinto del gregge a far sì che un’oncia d’oro possa valere così tanto. Quella oncia d’oro sarà la stessa per l’eternità:
Se si possiede un’oncia d’oro per un’eternità, sempre un’oncia d’oro essa sarà fino alla fine
Per chiarire ancora meglio la sua posizione sull’irreale valore dell’oro, Warren Buffett lo fa con un esempio durante la sua lettera annuale del 2011:
Oggi la quantità di oro mondiale è di circa 170.000 tonnellate. Se tutto questo oro venisse unito formerebbe un cubo di circa 68 piedi per lato. A $1.750 per oncia (il prezzo dell’oro nel momento in cui Buffet scriveva, ndr) il suo valore sarebbe di $9,6 trilioni. Chiamiamo questa pila di cubi A.

Creiamo ora una pila B che ha lo stesso prezzo. Per questo, potremmo acquistare tutti i terreni coltivati ​​negli Stati Uniti (400 milioni di ettari con una produzione di circa $200 miliardi l’anno), oltre a 16 Exxon Mobils (la società più redditizia del mondo, che guadagna più di $40 miliardi all’anno). Dopo questi acquisti, avremmo avuto circa 1 trilione di dollari in più. Riuscite a immaginare un investitore con $9,6 trilioni che sceglie la pila A invece della pila B?

Il bitcoin e l’oro sono quindi, per Buffet, asset che non producono nulla. Il loro valore cresce solo perché le persone continuano a investirci del denaro. Sono quindi catalogate dall’Oracolo di Omaha delle «bolle».
Fonte: qui 

venerdì 17 novembre 2017

It's A 'Turkey' Market

With Thanksgiving week rapidly approaching, I thought it was an apropos time to discuss what I am now calling a “Turkey” market.
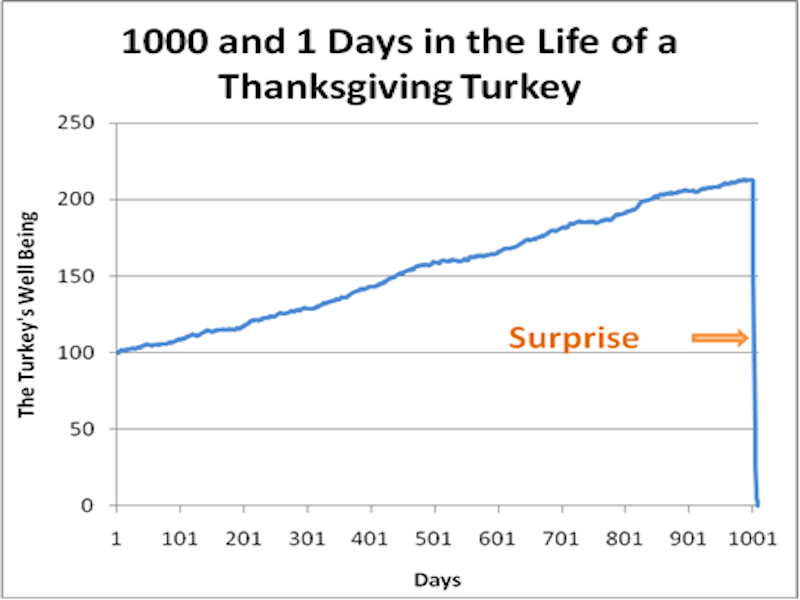
What’s a “Turkey” market?  Nassim Taleb summed it up well in his 2007 book “The Black Swan.”
“Consider a turkey that is fed every day. Every single feeding will firm up the bird’s belief that it is the general rule of life to be fed every day by friendly members of the human race ‘looking out for its best interests,’ as a politician would say.

On the afternoon of the Wednesday before Thanksgiving, something unexpected will happen to the turkey. It will incur a revision of belief.”
Such is the market we live in currently.
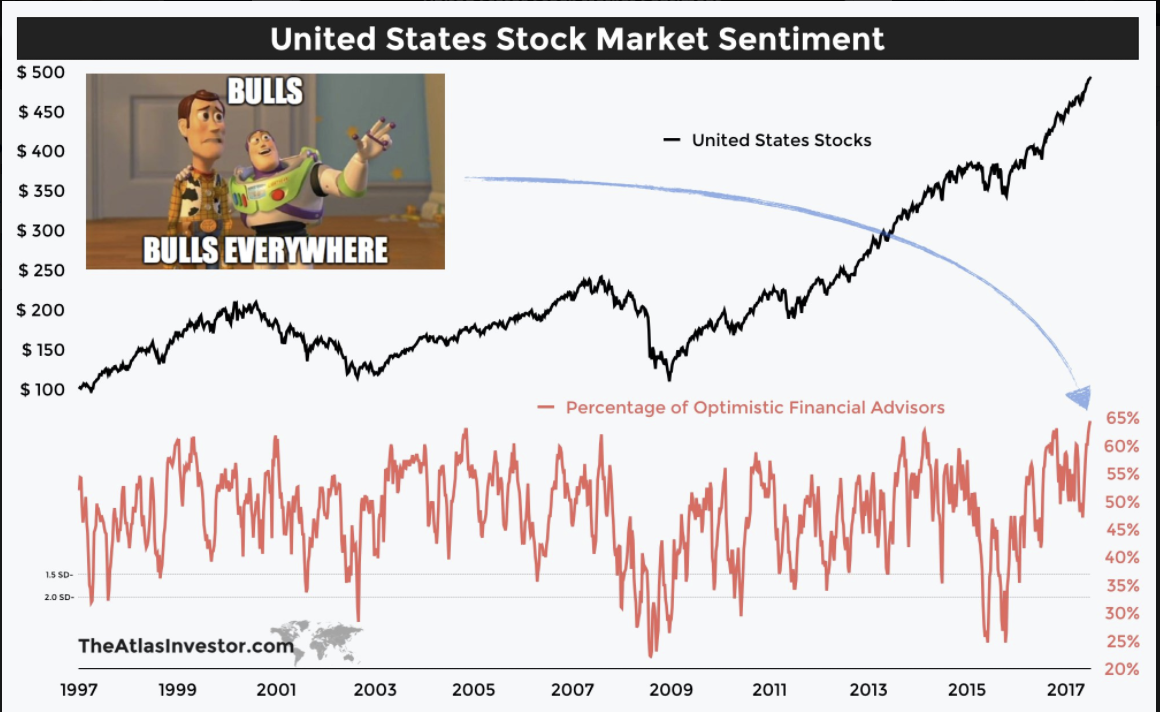
In a market that is excessively bullish and overly complacent, investors are “willfully blind” to the relevant “risks” of excessive equity exposure. The level of bullishness, by many measures, is extremely optimistic, as this chart from Tiho Krkan (@Tihobrkan) shows.
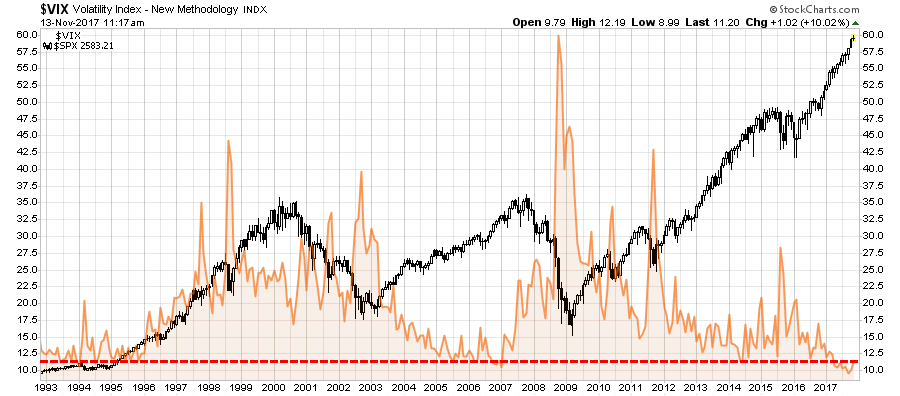
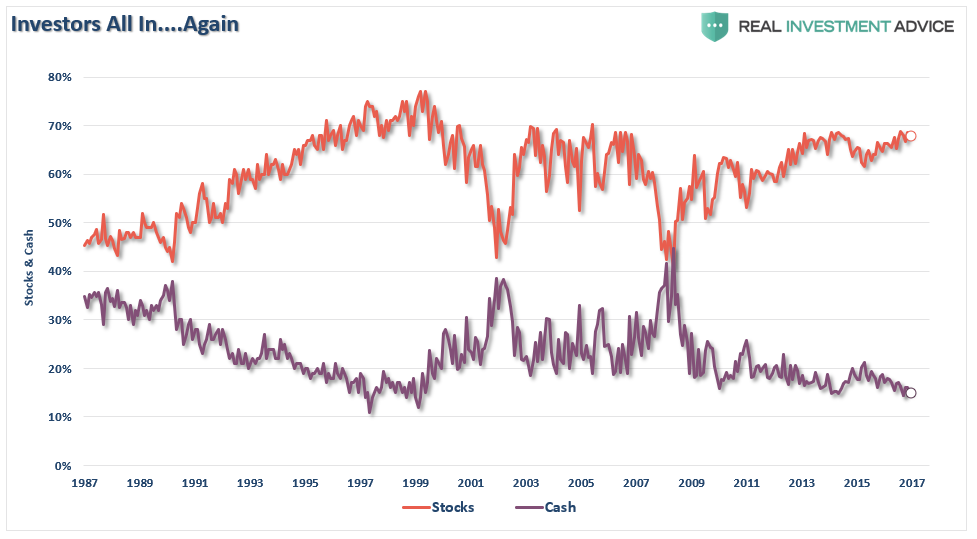
Not surprisingly, that extreme level of bullishness has led to some of the lowest levels of volatility and cash allocations in market history.
Of course, you can’t have a “Turkey” market unless you are being lulled into it with a supporting story that fits the overall narrative. The story of “it’s an earnings-driven market” is one such narrative. As noted  by my friend Doug Kass:
“Earnings are there to support the market. If we didn’t have earnings to support the market, that would be worrying. But we have earnings.”
—Mary Ann Bartels, Merrill Lynch Wealth Management


“Earnings are doing remarkably well.”
—Ed Yardeni, Yardeni Research


“This is very much an earnings-driven market.”
—Paul Springmeyer, U.S. Bancorp Private Wealth Management


“This is very much earnings-driven.”
—Michael Shaoul, Marketfield Asset Management


“Equities have largely been driven by global liquidity, but they are now being driven by earnings.”
—Kevin Boscher, Brooks Macdonald International


“Most of the market action in 2017 has been earning-driven.”
—Dan Chung, Alger Management


“The action is justified because of earnings.“
—James Liu, Clearnomics


In another case of “Group Stink” and contrary to the pablum we hear from many of the business media’s talking heads, the U.S. stock market has not been an earnings-driven story in 2017. (I have included seven “earnings-driven” quotes above from recent interviews on CNBC, but there are literally hundreds of these interviews, all saying the same thing)

Rather, it has been a valuation-driven story, just as it was in 2016 when S&P 500 profits were up 5% and the S&P Index rose by about 11%. And going back even further, since 2012 S&P earnings have risen by 30% compared to an 80% rise in the price of the S&P lndex!
He is absolutely right, of course, as I examined in the drivers of the market rally three weeks ago.
“The chart below expands that analysis to include four measures combined: Economic growth, Top-line Sales Growth, Reported Earnings, and Corporate Profits After Tax. While quarterly data is not yet available for the 3rd quarter, officially, what is shown is the market has grown substantially faster than all other measures. Since 2014, the economy has only grown by a little less than 9%, top-line revenues by just 3% along with corporate profits after tax, and reported earnings by just 2%. All of that while asset prices have grown by 29% through Q2.” 
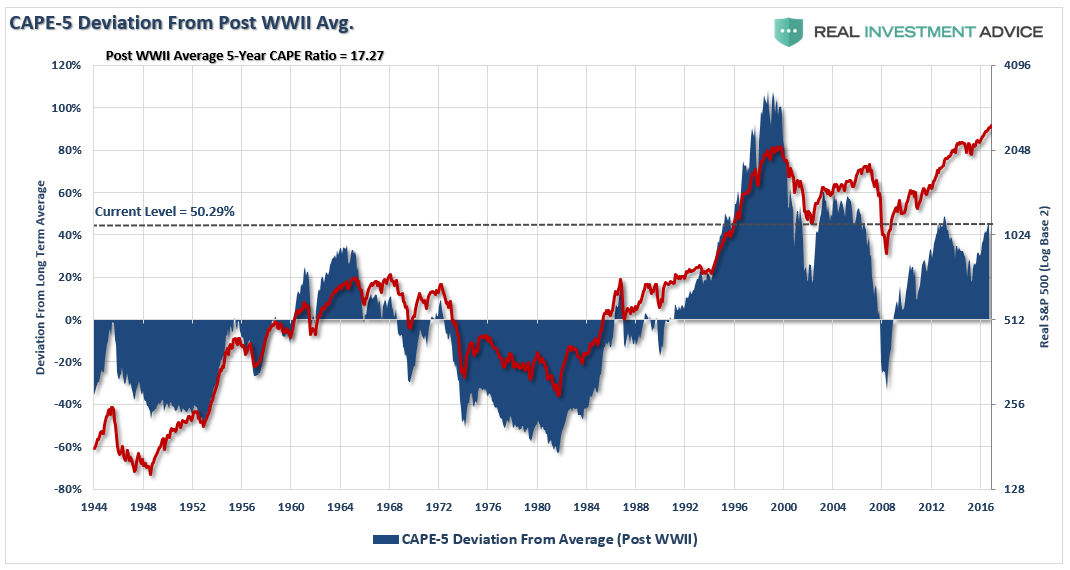
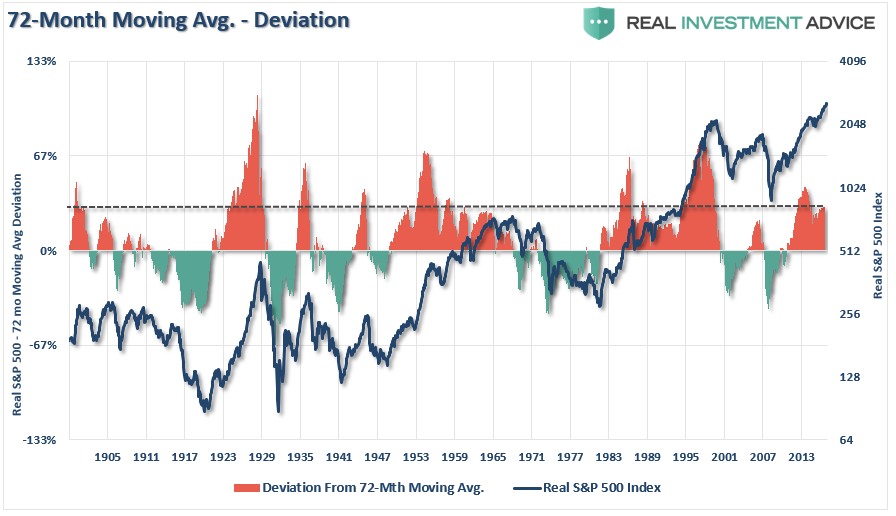
The hallmark of a “Turkey” market really comes down to the detachment of price from valuation and the deviation of price from long-term norms. Both of these detachments are shown in the charts below.
CAPE-5 is a modified version of Dr. Robert Shiller’s smoothed 10-year average. By using a 5-year average of CAPE (Cyclically Adjusted Price Earnings) ratio, it becomes more sensitive to market movements. Historically, deviations above 40% have preceded secular bear markets, while deviations exceeding -40% preceded secular bull markets.
The next chart shows the deviation of the real, inflation-adjusted S&P 500 index from the 6-year (72-month) moving average.
Not surprisingly, when the price of the index has deviated significantly from the underlying long-term moving averages, corrections and bear markets have not been too distant.
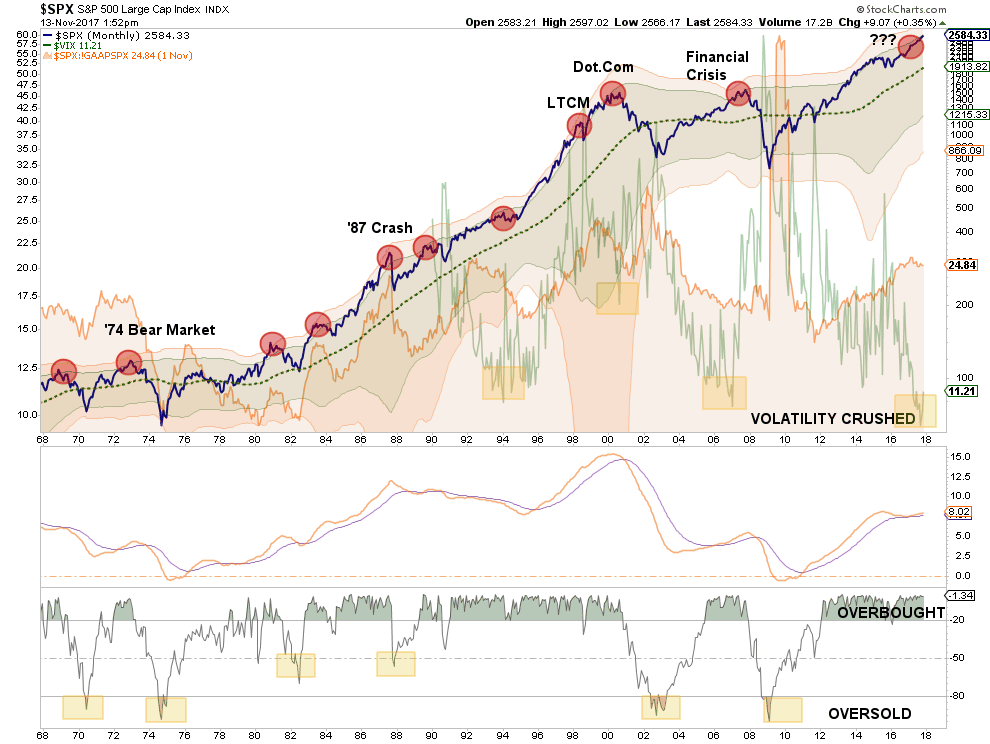
Combining the above measures (volatility, valuation, and deviation) together shows this a bit more clearly. The chart shows both 2 and 3-standard deviations above the 6-year moving average. The red circles denote periods where valuations, complacency and 3-standard deviation moves have converged. 
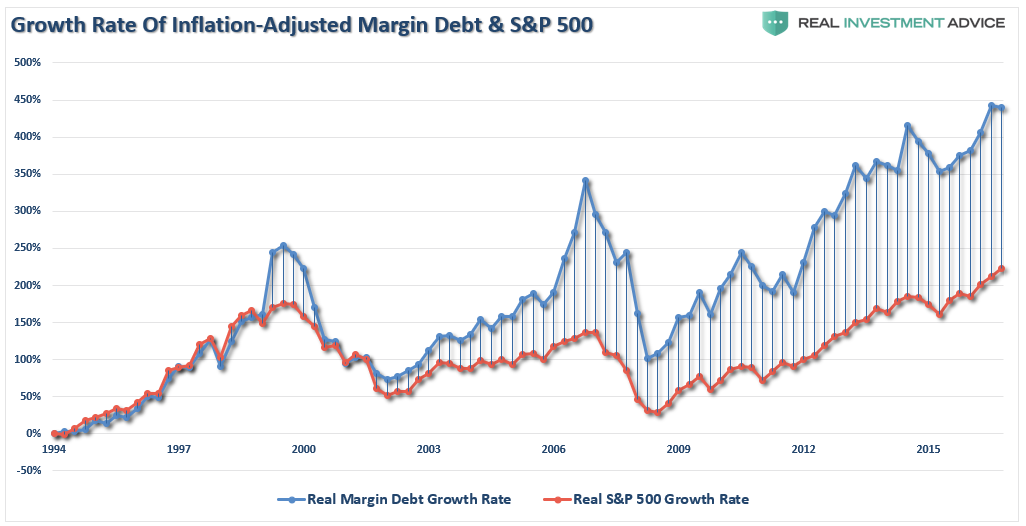
Of course, with cash balances low, you can’t foster that kind of extension without sufficiently increasing leverage in the overall system. The expansion of margin debt is a good proxy for the “fuel” driving the bull market advance.
Naturally, as long as that “fuel” isn’t ignited, leverage can remain supportive of the market’s advance. However, when the reversion begins, the “fuel” that drove stocks higher will “explode” when selling forces liquidation through margin calls.
While the media continues to suggest the markets are free from risk, and investors should go ahead and “stick-their-necks-out,” history shows that periods of low volatility, high valuations and deviations from long-term means has resulted in very poor outcomes.
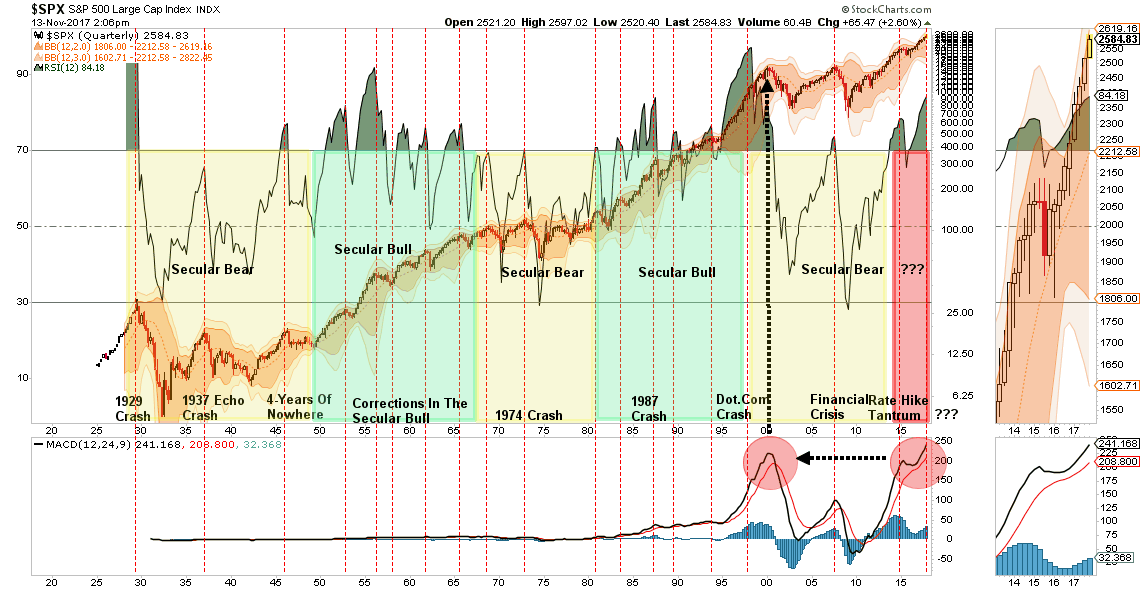
Lastly, there has been a lot of talk about how markets have entered into a new “secular bull market” period. As I have addressed previously, I am not sure such is the case. Given the debt, demographic and deflationary backdrop, combined with the massive monetary interventions of global Central Banks, it is entirely conceivable the current advance remains part of the secular bear market that began at the turn of the century.
Only time will tell.
Regardless, whether this is a bull market rally in an ongoing bear market, OR a bull rally in a new bull market, whenever the RSI (relative strength index) on a 3-year basis has risen above 70 it has usually marked the end of the current advance. Currently, at 84, there is little doubt the market has gotten ahead of itself.
No matter how you look at it, the risk to forward returns greatly outweighs the reward presently available.
Importantly, this doesn’t mean that you should “sell everything” and go hide in cash, but it does mean that being aggressively exposed to the financial markets is no longer opportune.
What is clear is that this is no longer a “bull market.”
It has clearly become a “Turkey” market. Unfortunately, like Turkeys, we really have no clue where we are on the current calendar. We only know that today is much like yesterday, and the “bliss” of calm and stable markets have lulled us into extreme complacency.
You can try and fool yourself that weak earnings growth, low interest rates and high-valuations are somehow are justified. The reality is, like Turkeys, we will ultimately be sadly mistaken and learn a costly lesson.
“Price is what you pay, Value is what you get.” – Warren Buffett
Authored by Lance Roberts via RealInvestmentAdvice.com,