
With Thanksgiving week rapidly approaching, I thought it was an apropos time to discuss what I am now calling a “Turkey” market.
What’s a “Turkey” market? Nassim Taleb summed it up well in his 2007 book “The Black Swan.”
“Consider a turkey that is fed every day. Every single feeding will firm up the bird’s belief that it is the general rule of life to be fed every day by friendly members of the human race ‘looking out for its best interests,’ as a politician would say.On the afternoon of the Wednesday before Thanksgiving, something unexpected will happen to the turkey. It will incur a revision of belief.”
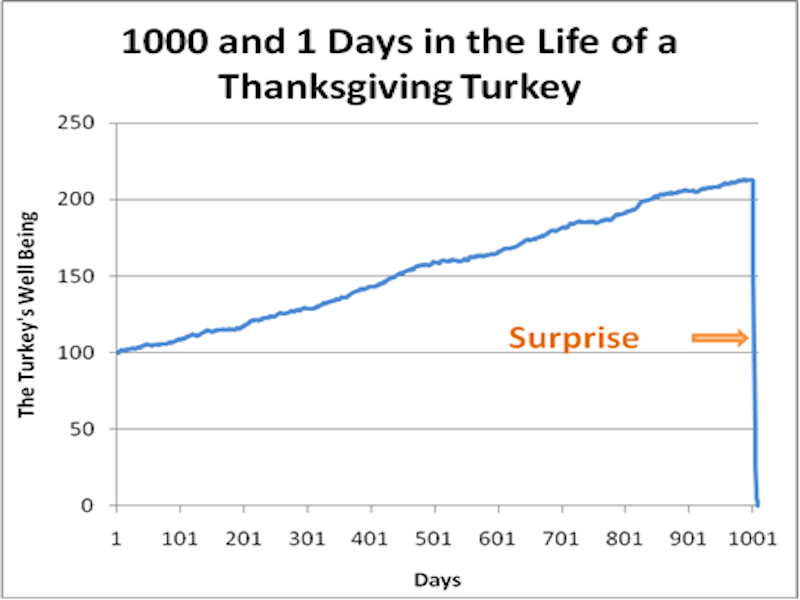
Such is the market we live in currently.
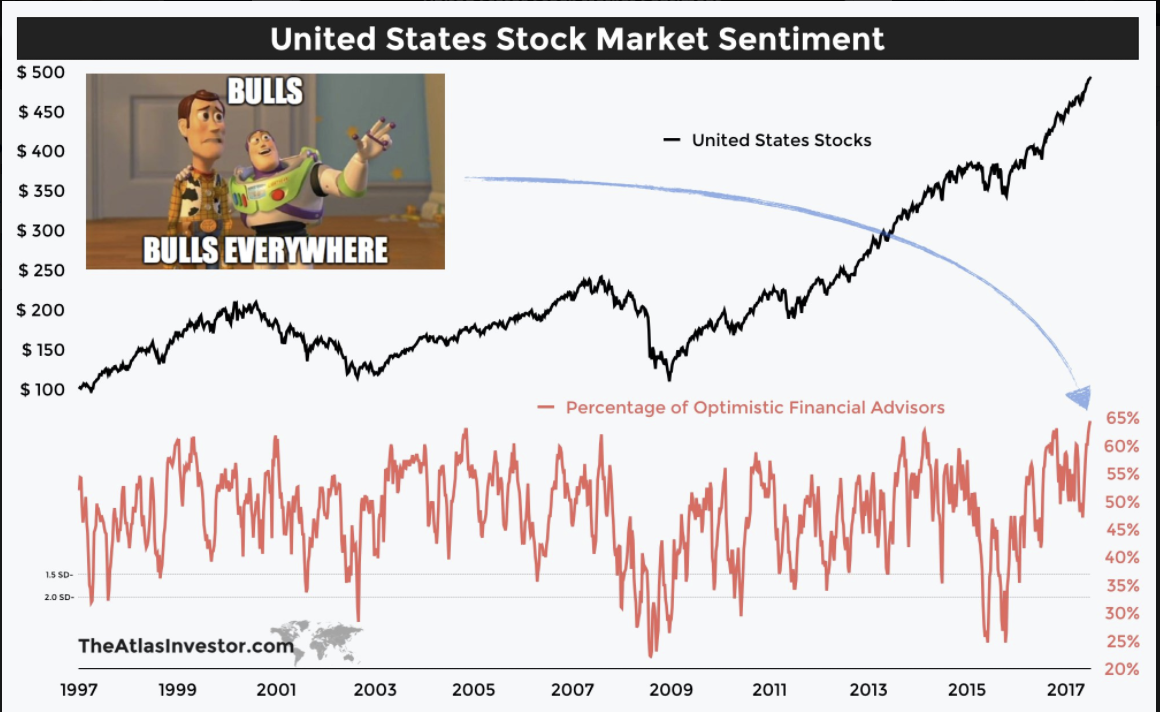
In a market that is excessively bullish and overly complacent, investors are “willfully blind” to the relevant “risks” of excessive equity exposure. The level of bullishness, by many measures, is extremely optimistic, as this chart from Tiho Krkan (@Tihobrkan) shows.
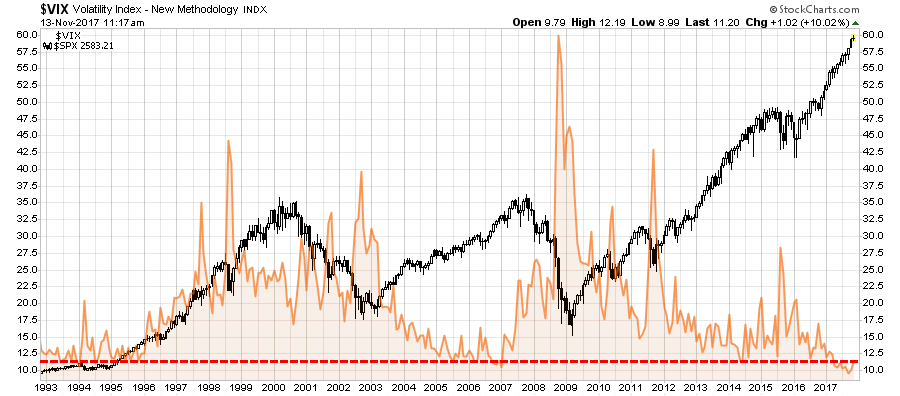
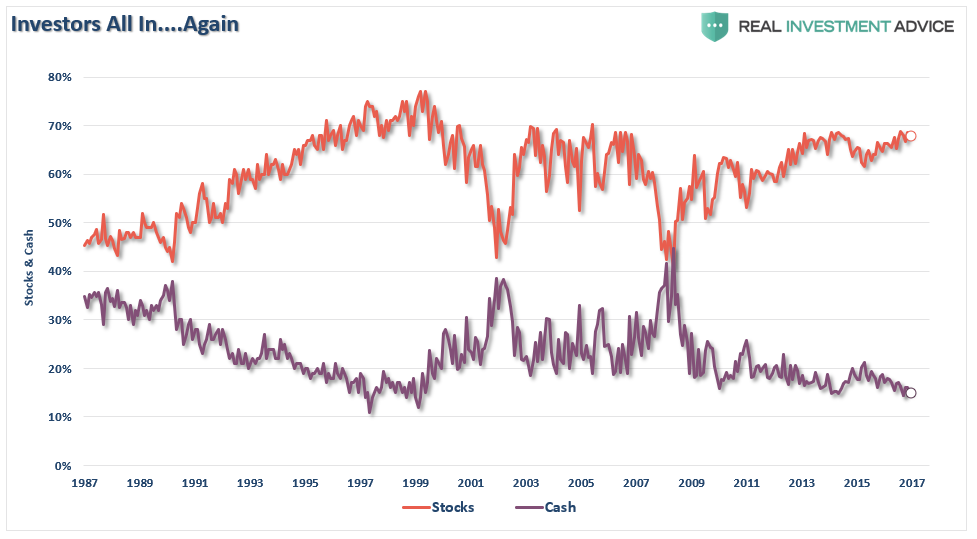
Not surprisingly, that extreme level of bullishness has led to some of the lowest levels of volatility and cash allocations in market history.
Trending Articles


Of course, you can’t have a “Turkey” market unless you are being lulled into it with a supporting story that fits the overall narrative. The story of “it’s an earnings-driven market” is one such narrative. As noted by my friend Doug Kass:
“Earnings are there to support the market. If we didn’t have earnings to support the market, that would be worrying. But we have earnings.”—Mary Ann Bartels, Merrill Lynch Wealth Management
“Earnings are doing remarkably well.”—Ed Yardeni, Yardeni Research
“This is very much an earnings-driven market.”—Paul Springmeyer, U.S. Bancorp Private Wealth Management
“This is very much earnings-driven.”—Michael Shaoul, Marketfield Asset Management
“Equities have largely been driven by global liquidity, but they are now being driven by earnings.”—Kevin Boscher, Brooks Macdonald International
“Most of the market action in 2017 has been earning-driven.”—Dan Chung, Alger Management
“The action is justified because of earnings.“—James Liu, Clearnomics
In another case of “Group Stink” and contrary to the pablum we hear from many of the business media’s talking heads, the U.S. stock market has not been an earnings-driven story in 2017. (I have included seven “earnings-driven” quotes above from recent interviews on CNBC, but there are literally hundreds of these interviews, all saying the same thing)Rather, it has been a valuation-driven story, just as it was in 2016 when S&P 500 profits were up 5% and the S&P Index rose by about 11%. And going back even further, since 2012 S&P earnings have risen by 30% compared to an 80% rise in the price of the S&P lndex!
He is absolutely right, of course, as I examined in the drivers of the market rally three weeks ago.
“The chart below expands that analysis to include four measures combined: Economic growth, Top-line Sales Growth, Reported Earnings, and Corporate Profits After Tax. While quarterly data is not yet available for the 3rd quarter, officially, what is shown is the market has grown substantially faster than all other measures. Since 2014, the economy has only grown by a little less than 9%, top-line revenues by just 3% along with corporate profits after tax, and reported earnings by just 2%. All of that while asset prices have grown by 29% through Q2.”

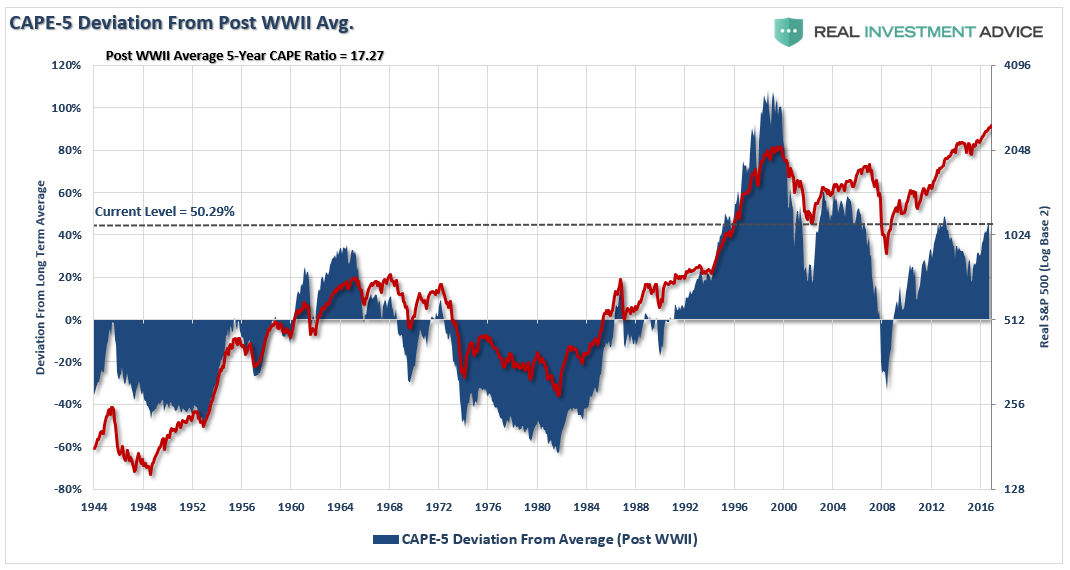
The hallmark of a “Turkey” market really comes down to the detachment of price from valuation and the deviation of price from long-term norms. Both of these detachments are shown in the charts below.
CAPE-5 is a modified version of Dr. Robert Shiller’s smoothed 10-year average. By using a 5-year average of CAPE (Cyclically Adjusted Price Earnings) ratio, it becomes more sensitive to market movements. Historically, deviations above 40% have preceded secular bear markets, while deviations exceeding -40% preceded secular bull markets.
The next chart shows the deviation of the real, inflation-adjusted S&P 500 index from the 6-year (72-month) moving average.
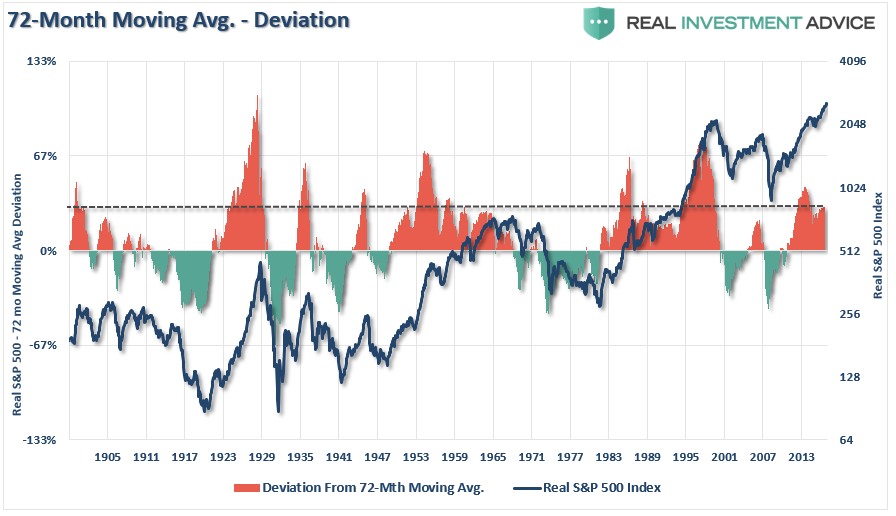
Not surprisingly, when the price of the index has deviated significantly from the underlying long-term moving averages, corrections and bear markets have not been too distant.
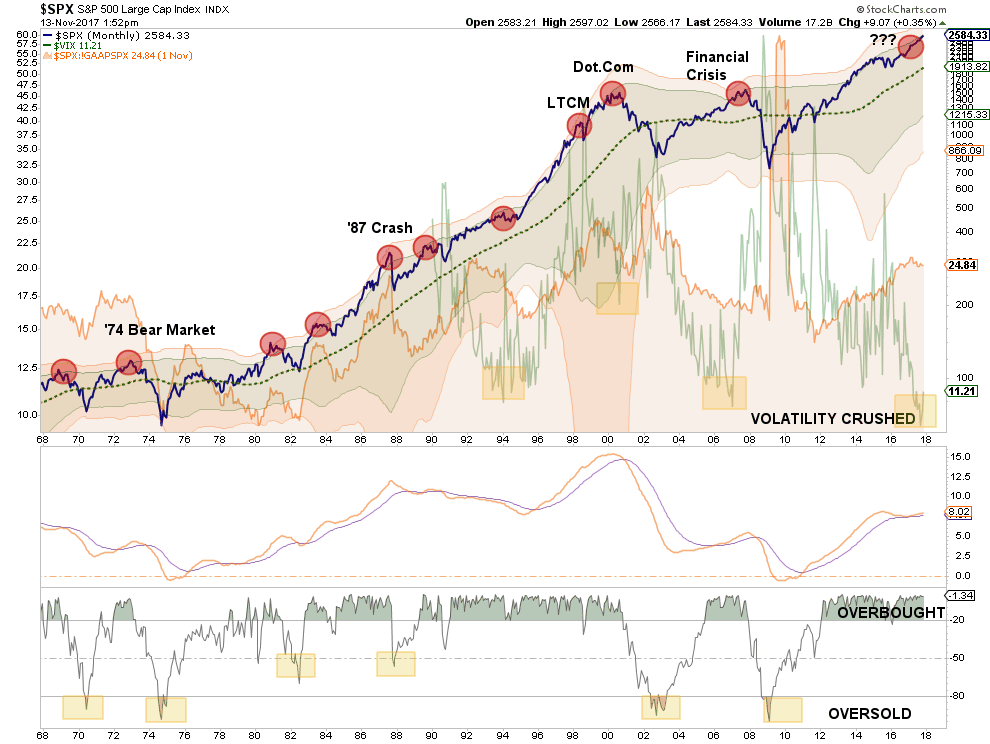
Combining the above measures (volatility, valuation, and deviation) together shows this a bit more clearly. The chart shows both 2 and 3-standard deviations above the 6-year moving average. The red circles denote periods where valuations, complacency and 3-standard deviation moves have converged.
Of course, with cash balances low, you can’t foster that kind of extension without sufficiently increasing leverage in the overall system. The expansion of margin debt is a good proxy for the “fuel” driving the bull market advance.
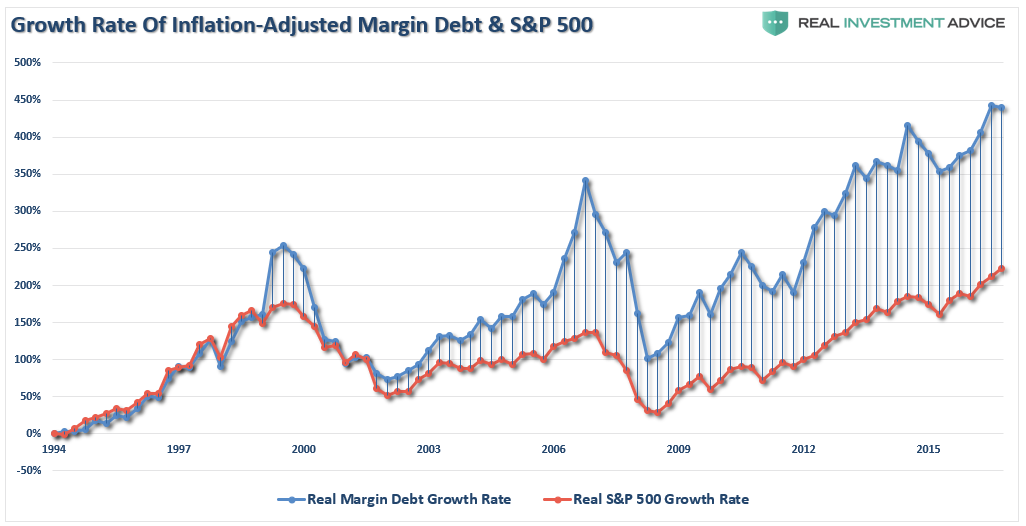
Naturally, as long as that “fuel” isn’t ignited, leverage can remain supportive of the market’s advance. However, when the reversion begins, the “fuel” that drove stocks higher will “explode” when selling forces liquidation through margin calls.
While the media continues to suggest the markets are free from risk, and investors should go ahead and “stick-their-necks-out,” history shows that periods of low volatility, high valuations and deviations from long-term means has resulted in very poor outcomes.
Lastly, there has been a lot of talk about how markets have entered into a new “secular bull market” period. As I have addressed previously, I am not sure such is the case. Given the debt, demographic and deflationary backdrop, combined with the massive monetary interventions of global Central Banks, it is entirely conceivable the current advance remains part of the secular bear market that began at the turn of the century.
Only time will tell.
Regardless, whether this is a bull market rally in an ongoing bear market, OR a bull rally in a new bull market, whenever the RSI (relative strength index) on a 3-year basis has risen above 70 it has usually marked the end of the current advance. Currently, at 84, there is little doubt the market has gotten ahead of itself.
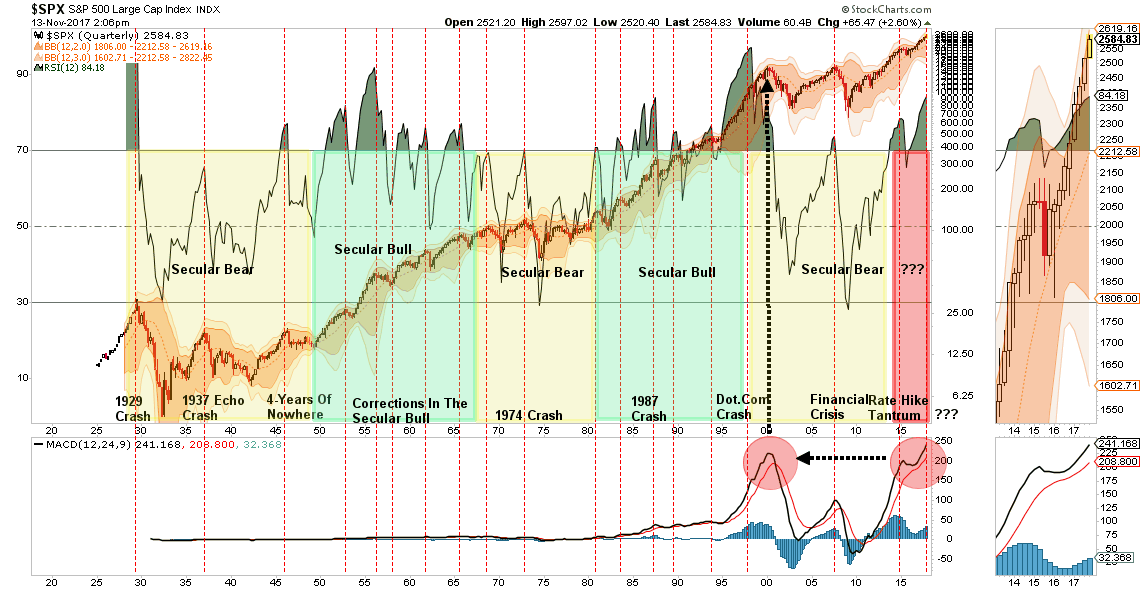
No matter how you look at it, the risk to forward returns greatly outweighs the reward presently available.
Importantly, this doesn’t mean that you should “sell everything” and go hide in cash, but it does mean that being aggressively exposed to the financial markets is no longer opportune.
What is clear is that this is no longer a “bull market.”
It has clearly become a “Turkey” market. Unfortunately, like Turkeys, we really have no clue where we are on the current calendar. We only know that today is much like yesterday, and the “bliss” of calm and stable markets have lulled us into extreme complacency.
You can try and fool yourself that weak earnings growth, low interest rates and high-valuations are somehow are justified. The reality is, like Turkeys, we will ultimately be sadly mistaken and learn a costly lesson.
Authored by Lance Roberts via RealInvestmentAdvice.com,“Price is what you pay, Value is what you get.” – Warren Buffett


