9 dicembre forconi: Citigroup
Visualizzazione post con etichetta Citigroup. Mostra tutti i post

giovedì 7 dicembre 2017

This Time Is Different, It Just Ends The Same

This past weekend, I was in Florida with Chris Martenson and Nomi Prins discussing the current backdrop of the markets, economic cycles, and future outcomes. A bulk of the conversations centered around the current “everything bubble” that currently exists globally. Elevated valuations in stock prices, extremely low yields between in “junk bonds,” or intense speculation around “cryptocurrencies” all suggest we have entered once again into “bubble” territory.”
Let me state this:
“Market bubbles have NOTHING to do with valuations or fundamentals.”
Hold on…don’t start screaming “heretic” and building gallows just yet. Let me explain.
Stock market bubbles are driven by speculation, greed, and emotional biases – therefore valuations and fundamentals are simply a reflection of those emotions.
In other words, bubbles can exist even at times when valuations and fundamentals might argue otherwise. Let me show you a very basic example of what I mean. The chart below is the long-term valuation of the S&P 500 going back to 1871.
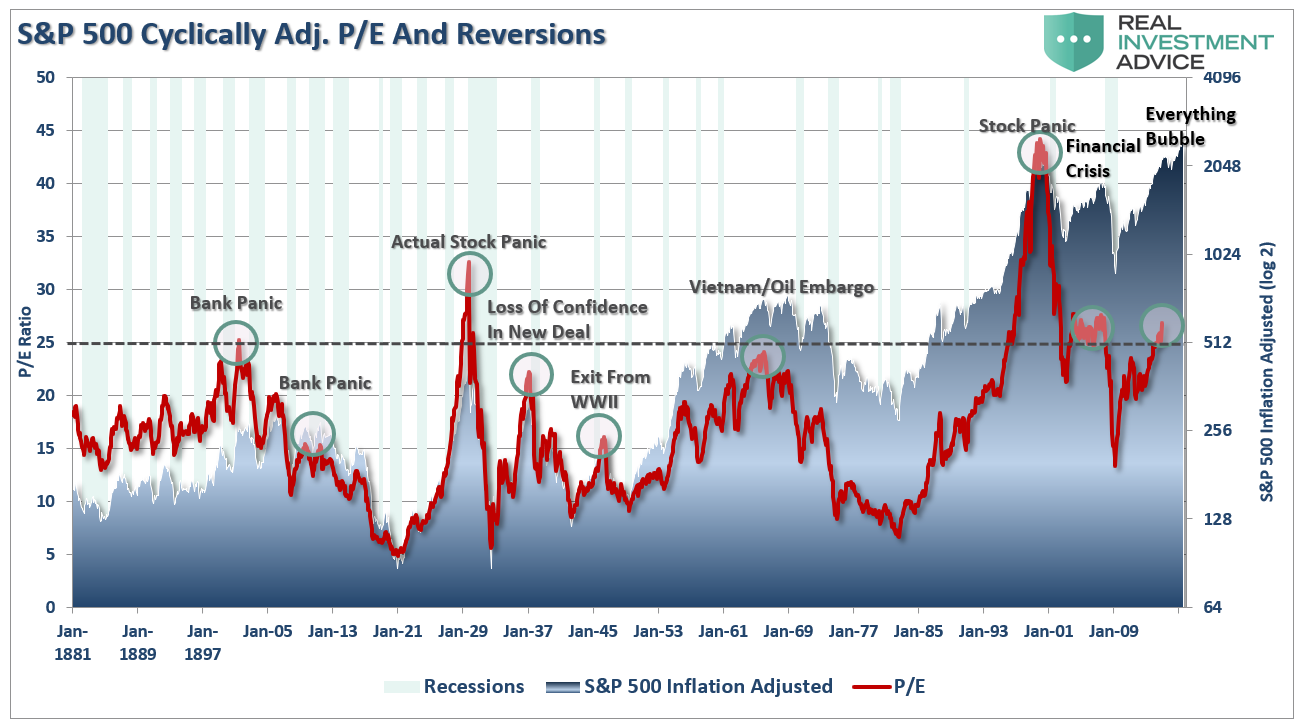
First, it is important to notice that with the exception of only 1929, 2000 and 2007, every other major market crash occurred with valuations at levels LOWER than they are currently. Secondly, all of these crashes have been the result of things unrelated to valuation levels such as liquidity issues, government actions, monetary policy mistakes, recessions or inflationary spikes. However, those events were only a catalyst, or trigger, that started the “panic for the exits” by investors.
Market crashes are an “emotionally” driven imbalance in supply and demand. You will commonly hear that “for every buyer, there must be a seller.” This is absolutely true. The issue becomes at “what price.” What moves prices up and down, in a normal market environment, is the price level at which a buyer and seller complete a transaction.
In a market crash, however, the number of people wanting to “sell” vastly overwhelms the number of people willing to “buy.” It is at these moments that prices drop precipitously as “sellers” drop the levels at which they are willing to dump their shares in a desperate attempt to find a “buyer.” This has nothing to do with fundamentals. It is strictly an emotional panic which is ultimately reflected by a sharp devaluation in market fundamentals.
Bob Bronson once penned:
“It can be most reasonably assumed that market are sufficient enough that every bubble is significantly different than the previous one, and even all earlier bubbles. In fact, it’s to be expected that a new bubble will always be different than the previous one(s) since investors will only bid up prices to extreme overvaluation levels if they are sure it is not repeating what led to the last, or previous bubbles. Comparing the current extreme overvaluation to the dotcom is intellectually silly.

I would argue that when comparisons to previous bubbles become most popular – like now – it’s a reliable timing marker of the top in a current bubble. As an analogy, no matter how thoroughly a fatal car crash is studied, there will still be other fatal car crashes in the future, even if the previous accident-causing mistakes are avoided.”
He is absolutely right. Comparing the current market bubble to any previous market bubble is rather pointless. Financial markets have already studied and adapted to the causes of the previous “fatal crashes” but this won’t prevent the next one.
I previously discussed George Soros’ theory on bubbles which is worth reviewing at this juncture:
“First, financial markets, far from accurately reflecting all the available knowledge, always provide a distorted view of reality. The degree of distortion may vary from time to time. Sometimes it’s quite insignificant, at other times it is quite pronounced. When there is a significant divergence between market prices and the underlying reality the markets are far from equilibrium conditions.

Every bubble has two components:
  1. An underlying trend that prevails in reality, and; 
  2. A misconception relating to that trend.

When a positive feedback develops between the trend and the misconception, a boom-bust process is set in motion. The process is liable to be tested by negative feedback along the way, and if it is strong enough to survive these tests, both the trend and the misconception will be reinforced. Eventually, market expectations become so far removed from reality that people are forced to recognize that a misconception is involved. A twilight period ensues during which doubts grow, and more people lose faith, but the prevailing trend is sustained by inertia.

As Chuck Prince, former head of Citigroup, said, ‘As long as the music is playing, you’ve got to get up and dance. We are still dancing.’ Eventually, a tipping point is reached when the trend is reversed; it then becomes self-reinforcing in the opposite direction.”
Typically bubbles have an asymmetric shape. The boom is long and slow to start. It accelerates gradually until it flattens out again during the twilight period. The bust is short and steep because it involves the forced liquidation of unsound positions.
The chart below is an example of asymmetric bubbles.
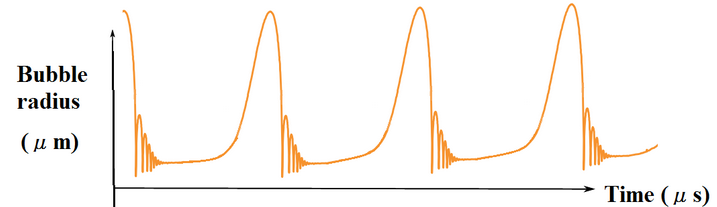
The pattern of bubbles is interesting because it changes the argument from a fundamental view to a technical view. Prices reflect the psychology of the market which can create a feedback loop between the markets and fundamentals.
This pattern of bubbles can be clearly seen at every bull market peak in history. The chart below utilizes Dr. Robert Shiller’s stock market data going back to 1900 on an inflation-adjusted basis with an overlay of the asymmetrical bubble shape.
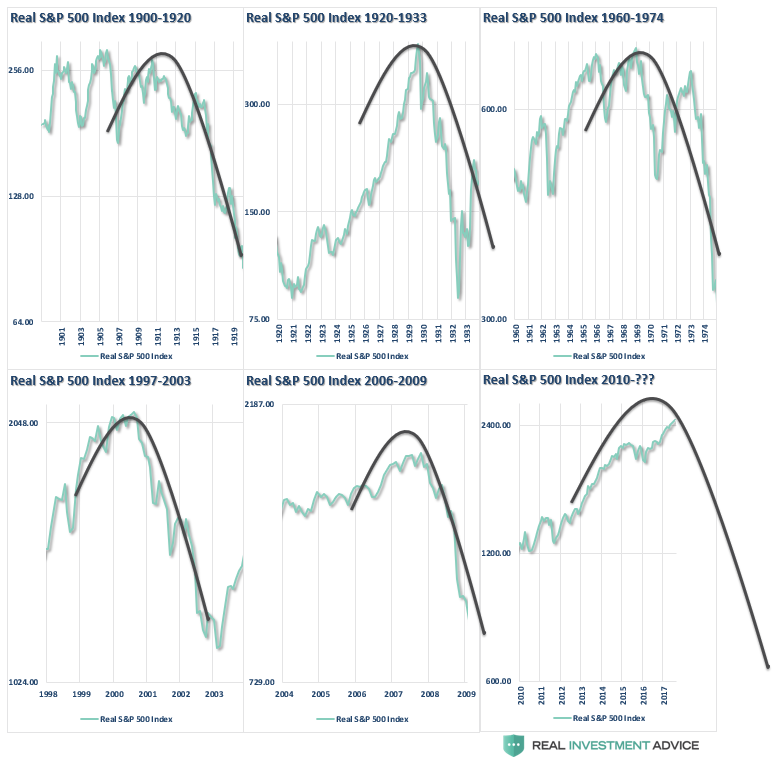
There is currently a strong belief that the financial markets are not in a bubble. The arguments supporting those beliefs are all based on comparisons to past market bubbles.
The inherent problem with much of the mainstream analysis is that it assumes everything remains status quo. However, the question becomes what can go wrong for the market?
In a word, “much.”
Economic growth remains very elusive, corporate profits appear to have peaked, and there is an overwhelming complacency with regards to risk. Those ingredients combined with an extraction of liquidity by the Federal Reserve leaves the markets more vulnerable to an exogenous event than currently believed.
It is likely that in a world where there is virtually “no fear” of a market correction, an overwhelming sense of “urgency” to be invested and a continual drone of “bullish chatter;” markets are poised for the unexpected, unanticipated and inevitable reversion.
As Chris Martenson recently penned:
I hate to break it to you, but chances are you’re just not prepared for what’s coming.

These bubbles – blown by central bankers serially addicted to creating them (and then riding to the rescue to fix them) – are the largest in all of history. That means they’re going to be the most destructive in history when they finally let go.

Millions of households will lose trillions of dollars in net worth. Jobs will evaporate, causing the tens of millions of families living paycheck to paycheck serious harm.

These are the kind of painful consequences central bank follies result in. They’re particularly regrettable because they could have been completely avoided if only we’d taken our medicine during the last crisis back in 2008.  But we didn’t. We let the Federal Reserve –the institution largely responsible for creating the Great Financial Crisis — conspire with its brethren central banks to ‘paper over’ our problems.
So now we are at the apex of the most incredible nest of financial bubbles in all of human history.”
I am not trying to scare the “bejeebers” out of you, but he is right.
“All financial assets are just claims on real wealth, not actual wealth itself.  A pile of money has use and utility because you can buy stuff with it.  But real wealth is the “stuff” — food, clothes, land, oil, and so forth.  If you couldn’t buy anything with your money/stocks/bonds, their worth would revert to the value of the paper they’re printed on (if you’re lucky enough to hold an actual certificate). It’s that simple.

But trouble begins when the system gets seriously out of whack.

‘GDP’ is a measure of the number of goods and services available and financial asset prices represent the claims (it’s not a very accurate measure of real wealth, but it’s the best one we’ve got, so we’ll use it). Look at how divergent asset prices get from GDP as bubbles develop.
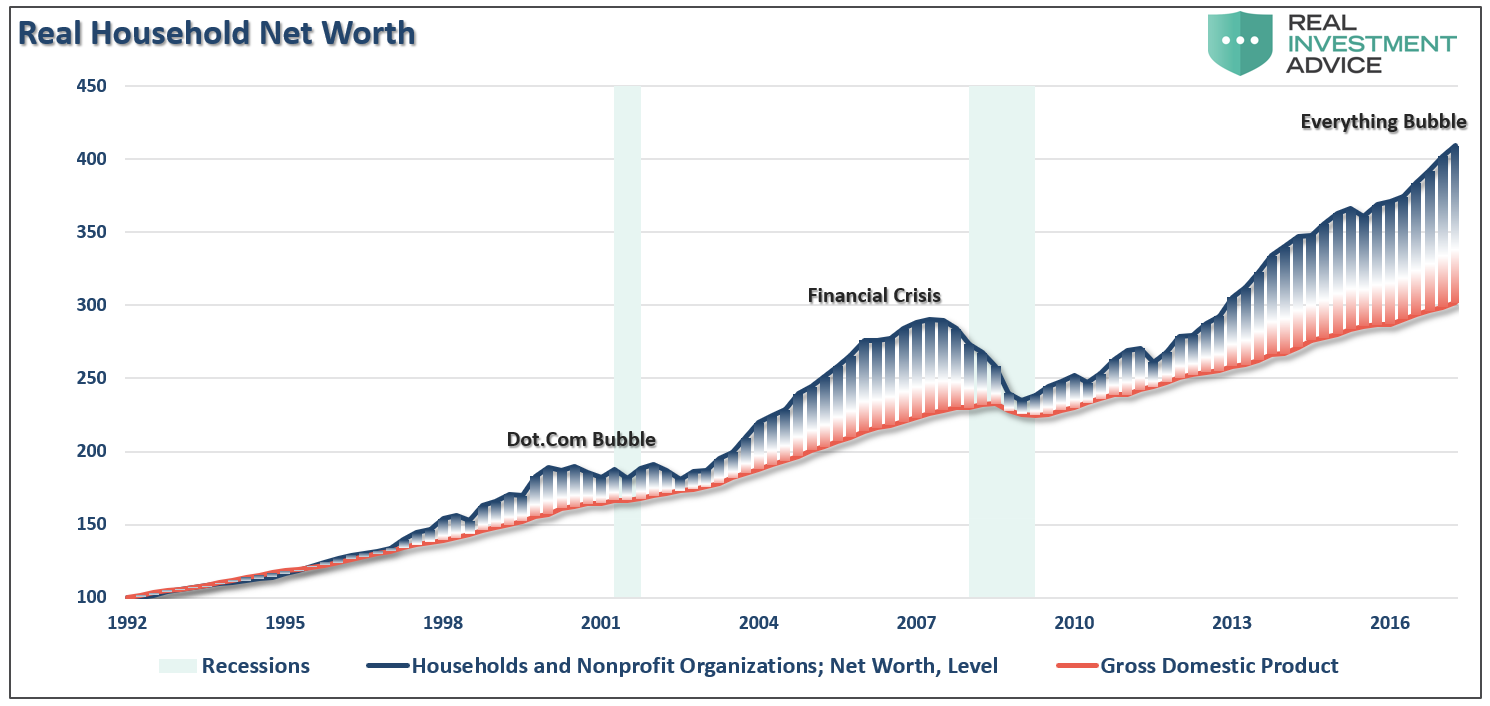
“What we see in the above chart is that the claims on the economy should, quite intuitively, track the economy itself.  Bubbles occurred whenever the claims on the economy, the so-called financial assets (stocks, bonds, and derivatives), get too far ahead of the economy itself.

This is a very important point. The claims on the economy are just that: claims.  They are not the economy itself!”
Take a step back from the media, and Wall Street commentary, for a moment and make an honest assessment of the financial markets today. If our job is to “bet” when the “odds” of winning are in our favor, then exactly how “strong” is the fundamental hand you are currently betting on?
This “time IS different” only from the standpoint that the variables are not exactly the same as they have been previously. Of course, they never are, and the result will be “…the same as it ever was.”

venerdì 30 settembre 2016

This Is How Much Liquidity Deutsche Bank Has At This Moment, And What Happens Next

It is not solvency, or the lack of capital - a vague, synthetic, and usually quite arbitrary concept, determined by regulators - that kills a bank; it is - as Dick Fuld will tell anyone who bothers to listen - the loss of (access to) liquidity: cold, hard, fungible (something Jon Corzine knew all too well when he commingled and was caught) cash, that pushes a bank into its grave, usually quite rapidly: recall that it took Lehman just a few days for its stock to plunge from the high double digits to zero.
It is also liquidity, or rather concerns about it, that sent Deutsche Bank stock crashing to new all time lows earlier today: after all, the investing world already knew for nearly two weeks that its capitalization is insufficient. As we reported earlier this week, it was a report by Citigroup, among many other, that found how badly undercapitalized the German lender is, noting that DB's "leverage ratio, at 3.4%, looks even worse relative to the 4.5% company target by 2018" and calculated that while he only models €2.9bn in litigation charges over 2H16-2017 - far less than the $14 billion settlement figure proposed by the DOJ - and includes a successful disposal of a 70% stake in Postbank at end-2017 for 0.4x book he still only reaches a CET 1 ratio of 11.6% by end-2018, meaning the bank would have a Tier 1 capital €3bn shortfall to the company target of 12.5%, and a leverage ratio of 3.9%, resulting in an €8bn shortfall to the target of 4.5%.
When Citi's note exposing DB's undercapitalization came out, it had precisely zero impact on the price of DB stock. Why? Because as we said above, capitalization - and solvency - tends to be a largely worthless, pro-forma concept. However, when Bloomberg reported today that select funds have withdrawn “some excess cash and positions held at the lender” the stock immediately plunged: the reason is that this had everything to do with not only DB's suddenly crashing liquidity, but the pernicious feedback loop, where once a source of liquidity leaves, the departure tends to spook other such sources, leading to an outward bound liquidity cascade. Again: just ask Lehman (and AIG) for the details.
Which then brings us to the $64 trillion (roughly the same amount as DB's gross notional derivative exposure) question: since DB is suddenly experiencing a sharp "liquidity event", how much liquidity does Deutsche Bank have access to as of this momentto offset this event? The answer would allow us to calculate how long DB may have in a worst case scenario if we knew the rate of liquidity outflow.
For the answer, we go to a just released note by Goldman Sachs, which admits that it is now facing "crisis" questions from clients, among which “can a large European bank face a liquidity event” to wit"
Deutsche Bank stands at the center of the European financial system - it is a major counterpart of all relevant European banks, and broader. Recent reports of potential litigation hits have compounded capital concerns, and raised the overall level of market anxiety. “Crisis” questions are being asked: “is there risk of a financial crisis re-run” and “can a large European bank face a liquidity event”?
So what is the answer: how much liquidity does Deutsche Bank have access to? The answer is two fold, with the first part focusing on central bank, in this case ECB, backstops in both $ and €. 
Goldman starts with an overview of said back-stops, summarized below. These facilities are available to all Eurozone banks (and, naturally, also to Deutsche Bank) – they are generous in terms of volume (full allotment), price (fixed rate at 0%) and tenure (from short term, all the way to 4-years). These ECB facilities are key to ensuring the bank's long-term funding stability, in Goldman's view, and were put in place following the funding market fallout in 2007, in order to contain the effects from the Lehman crisis. They were further bolstered to contain the Eurozone sovereign crisis in 2011-12. All of the liquidity provisions remain in place, and broadly, they fall into the following two categories:
  1. Regular market operations: 1-week Main Refinancing Operations or “MRO” (priced @0%), and 3-month Long Term Refinancing Operations or “LTRO” (@0%);
  2. Non-standard measures, which split between € funding facilities with 4-year Targeted LTROs (@0%, with the option to fall to -0.4% if lending targets are met) and the emergency liquidity assistance to solvent financial institutions and a US$ funding facility: 1-week US$ MRO (@0.86%).
Stepping away from the ECB - because if Deutsche is forced to come crawling to Draghi and beg for central bank liquidity assistance to continue as a going concern, the outcome may be just as dire (recall the stigma associated with US banks using the Fed's Discount Window) especially since  unlike Lehman, DB has nearly €600 billion in deposits which are susceptible to a retail depositor run - what about Deutsche Bank's own liquidity position? It is this which appears to be concerning the market most, because as Goldman writes, following the Bloomberg report that hedge fund clients have pulled excess cash, the market has reacted aggressively (ADR down 6.7%), indicating concerns have moved from DBK’s equity to question the resilience of the banks’ funding position.
Below, Goldman provides an overview of DBK’s liquidity position, noting that its last reported liquidity reserve stood at €223 bn or ~20% of its total assets. DBK’s high quality liquid assets (or HQLA) balance stood at €196 bn or 16% of its total assets; its liquidity coverage ratio (“LCR”) stood at 124%. DBK’s LCR is above that of many largest European banks (BNP 112%), as well as US banks (Citigroup
121%).

Here is the breakdown:
  • Liquidity reserve: €223 bn, or ~20% of total assets. In total, DBK’s liquidity reserve stood at €223 bn, representing ~20% of the banks total net assets (where assets are US GAAP equivalent). The 2Q16 level of liquidity reserve compares to €65 bn in 2007, showing that DBK has grown its liquidity reserve by 3.4x from pre-crisis levels.
  • Cash: €125 bn. The liquidity reserve breaks down between €125 bn of cash and cash equivalents, and €98 bn of securities, available for use at the central banks. As highlighted in Exhibit 2, the € portion of the securities can be used to obtain liquidity of varied duration (between O/N to 4-years) at a cost of 0% (and as low as -40 bp, if lending benchmarks are met).
  • LCR: 124%. DBK’s Liquidity Coverage ratio stood at 124%, which is ~1.5x the current regulatory minimum, and a cut above the 2019 fully-loaded requirement of 100%. This compares favorably to, say, Citigroup (121%), BNP (112%). Other US banks (e.g. JPM, BofA) do not disclose their LCR other than to say that they are “compliant”, suggesting LCR is at or above 100%.
Where does this liquidity come from? Exhibit 3 above examines DBK’s funding composition – this is relevant in the context of media reports highlighting a decline in prime brokerage balances (Bloomberg, September 29). These include:
  • Lowest volatility funding: 57%. Lowest volatility sources of funding - retail deposits, transaction banking balances (corporate and institutional deposits from corporate banking relationships) and equity account for 57% of total funding. Over half of the groups’ funding therefore, stems from this source.
  • Low volatility funds: 15%. Debt securities in issue account for 14% of total funding. Together with the previous category, “lowest” and “low” volatility funding accounts for 72% of total funding.
  • Other customers – this includes prime brokerage cash balance – 7%. The total amount of “other customer” funds, which includes: fiduciary, self-funding structures (e.g. X-markets), margin/Prime Brokerage cash balances (shown on a net basis (see DBK 2015 annual report, p178). Importantly, this represents ~7% of total funding, and is 3.1x covered with the liquidity reserve.
  • Other parts of funding – unsecured wholesale, secured funding – account for the residual.
In other words, all else equal, even in a worst case Prime Brokerage situation, one where all €71 billion in "other customer" funds flee, DB should still have about €152 billion of the €223 billion in liquidity reserve as of June 30, once again assuming there have been no other changes. Stated simply, if the hedge fund outflow accelerates and depletes all the liquidity at the Prime Brokerage division, DB would part with about a third (just over  €70 billion) of its €220 billion liquidity reserve.
Some other observations: even if one assumes the full loss of PB balances, DB would still have a Liquidity coverage ratio (“LCR”) of 124%.  The LCR is equivalent to HQLA/net stressed outflows over 30 day period. This ratio shows the banks’ ability to meet stressed funding conditions over a period of 1 month. For Deutsche bank, the LCR stood at 124% with the ratio composed of:
  1. High Quality Liquid Assets (HQLAs) of €196 bn. These include Level 1 assets (the most liquid securities which include cash and equivalents, bonds issued or guaranteed by a government and certain covered bonds); Level 2A assets, which are subject to a haircut (third country government bonds, bonds issued by public entities, EU covered bonds, non-EU covered bonds, corporate bonds) and Level 2B assets (high quality securitisations, corporate bonds, other high quality covered bonds).
  2. The net stressed outflows: €158 bn as of 2Q16 (YE15 €161 bn). DBK’s net stressed outflows amounted to €161 bn at year-end 2015, and include an assumption of loss of prime brokerage deposits. As per Commission Delegated Regulation (EU) 2015/61 “Deposits arising out of a correspondent banking relationship or from the provision of prime brokerage services shall not be treated as an operational deposit and shall receive a 100 % outflow rate.”
  3. The minimum level is 100% (effective 2018) and is phased in gradually from 2015; the 2016 requirement is 70%.
Of course, the "stressed outflow over a 30 day period" is an assumption, one which can accelerate rapidly, especially if the stock price of DB continues to fall crushing what is any bank's most critical asset: counterparty confidence, either from retail investors or institutional peers.
Still, what the above calculations reveals is that the Bloomberg report suggest that while substantial, the Prime Brokerage outflow would not be, on its own, deadly.  But therein lies the rub: since any bank's collapse is a procyclical event in which liquidity flees in all directions, with a speed that is usually inversely proportional to the stock price, the lower the price of DB goes (and the higher its CDS), the more dire its liquidity situation.
However, as noted above, the biggest threat to DB is not so much its hedge fund client base, whose damage potential is limited, but the depositor base. Again: while Lehman failed, it did so as a result of its corporate counterparties suffocating the bank by rapidly pulling out their liquidity lines. Lehman, however, was lucky in that it didn't have retail depositors: it death would have likely come far faster as the capital panic was not limited to institutions but also included a retail depositor bank run.
This is where Deutsche Bank is very different from Lehman, and far riskier, because if the institutional panic spreads to the depositor base, which as the table below shows amounts to some €566 billion in total, and €307 billion in retail deposits...

... then all bets are off.
Which is why it is so critical for Angela Merkel to halt the plunging stock price, an indicator DB's retail clients, simplistically (and not erroneously) now equate with the bank's viability, and the lower the price drops, the faster they will pull their deposits, the quicker DB's liquidity hits zero, the faster the self-fulfilling prophecy of Deutsche Bank's death is confirmed.
Which ultimately means that DB really has four options: raise capital (sell equity, convert CoCos, which may results in an even bigger drop in the stock price due to dilution or concerns the liquidity raise may not be sufficient), approach the ECB for a liquidity bridge (this may also backfire as counterparties scramble to flee a central bank-backstopped institution), appeal for a state bailout (Merkel has so far said "Nein") or implement a bail-in,eliminating billions in unsecured claims (and deposits) and leading to a full-blown systemic bank run as depositors everywhere rush to withdraw their savings, leading to a collapse of the fractional reserve banking mode (in which there is only 10 cents in physical deliverable cash for every dollar in depositor claims). 
Which of the four choices Deutsche Bank will pick should become clear in the coming days. Until it does, it will keep the market on edge and quite volatile, because as Jeff Gundlach explained today, a "do nothing" scenario is no longer an option for CEO John Cryan as the market will keep pushing the price of DB lower until it either fails, or is bailed out.


P.S.: potete usare la funzione TRANSLATE di Google(sulla colonna di destra), selezionando prima un qualsiasi linguaggio e poi successivamente, l'italiano, per avere la traduzione automatica.


N.B. Non c’è pace per la Deutsche Bank. Ieri pomeriggio il titolo è nuovamente crollato sotto il peso di una notizia diffusa da Bloomberg. Una decina di hedge fund avrebbero ritirato i loro derivati da Deutsche per spostarli nelle banche concorrenti. Un portavoce ha dichiarato che «i nostri clienti sono tra i più sofisticati investitori del mondo » e ha aggiunto che «la stragrande maggioranza dei clienti sa che la nostra situazione finanziaria è stabile ed è a conoscenza della situazione economica generale, dei contenziosi in corso con l’autorità giudiziaria americana e con i progressi che stiamo facendo con la nostra strategia».

schauble MERKELSCHAUBLE MERKEL
In effetti lo stesso documento interno precisa che al di là dei dieci fondi, altri 200 clienti che investono in derivati non hanno cambiato la loro posizione. Secondo il Financial Times che cita fonti di Deutsche, alcuni clienti degli hedge fund avrebbero chiesto una maggiore protezione dai rischi sugli affari soprattutto in risposta alle incessanti notizie stampa allarmanti.

Ieri Marcel Fratzscher, capo del think tank Diw di Berlino ha sottolineato che se la situazione dovesse peggiorare, «il governo tedesco interverrà: Deutsche Bank è l’unica banca d’investimento che ha». 

Ma Yigit Bulut, consigliere economico del presidente turco Erdogan ha esortato il suo Paese a investire nella banca per farla diventare Tuerkisch Bank. Il titolo ormai vale 10 euro: prima della crisi ne valeva 100. 

Fonte: qui