9 dicembre forconi: yield
Visualizzazione post con etichetta yield. Mostra tutti i post

giovedì 20 settembre 2018

Rapporto bond-azionario. L’ultima volta che si è presentato questo fenomeno è arrivata la recessione

L’ultima volta che i bond sono stati appetibili così come l’azionario, è iniziata la recessione. E’ quanto riporta un articolo di Bloomberg, riferendosi ai massimi della sessione che, alla vigilia, sono stati testati dai rendimenti dei Treasuries a 10 anni, saliti fino al 3,04%.


Sempre ieri, lo spread tra il dividend yield dello S&P 500 è salito a 124 punti base, al valore più alto dal 2011.

Cosa significa per gli investitori? Intanto, c’è da dire che a puntare verso l’alto, da un po’ di tempo a questa parte, sono anche i tassi della parte front della curva dei rendimenti.
Basti pensare che, per la prima volta dopo la crisi finanziaria, e a seguito dell’asta dei bond Usa a quattro settimane, che ha rivelato tassi al 2,02%, al massimo dal febbraio del 2018, i rendimenti dei titoli di stato Usa a 4, 13 e 26 settimane si sono posizionati tutti attorno a valori superiori al 2%. Non solo: a balzare al record dal gennaio del 2008 sono stati anche i rendimenti dei titoli a due anni.
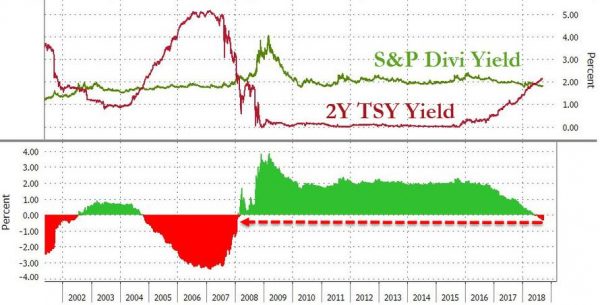
Fattore ancora più importante, il rapporto tra i tassi a due anni e lo S&P 500 mostra che, con uno spread pari a 36 punti base, la parte a breve della curva versa ora in una posizione, in termini di rendimenti, migliore di quella dello S&P (pari all’1,81%).
Peccato, però, come mostra anche l’ultimo grafico che, l’ultima volta che il differenziale sui rendimenti è stato così generoso a favore dei bond, è avvenuto neldicembre del 2007, anno che alcuni trader fanno corrispondere all‘inizio ufficiale della recessione.
Quanto è reale il rischio di recessione, a parte il trend di questo parametro? Per ora non è dato sapere con esattezza, anche se nelle ultime settimane diversi economisti, in occasione del decimo anniversario di Lehman Brothers, hanno paventato scenari più o meno foschi, come quello di Nouriel Roubini, che ha assegnato una data a quando esploderà la prossima crisi.
Sta di fatto che, da un recente sondaggio di BofA Fund Manager è emerso che i gestori di fondi sono sempre più pessimisti sull’outlook dell’economia mondiale: il 24% degli investitori interpellati ritiene per esempio che la crescita del Pil globale rallenterà il prossimo anno, in deciso rialzo rispetto alla percentuale netta del 7% di agosto. Si tratta del numero più alto di pessimisti sul trend dell’economia globale dal dicembre del 2011.

Fonte: qui

giovedì 26 luglio 2018

Beware – The Last 7 Times The Yield Curve Inverted The U.S. Economy Was Hit By A Recession


Seven times since the 1960s we have seen the yield curve invert, and in each of those seven instances an economic recession in the United States has followed.  Will this time be any different?  Today, the yield curve is the flattest that it has been in 11 years, and many analysts believe that we will see an inversion before the end of 2018.  If an inversion does take place, experts will be all over the mainstream media warning about “an imminent recession”.  Unfortunately, most Americans don’t understand these things, and when they hear terms like “yield curve” they tend to quickly tune out.  So in this article we are doing to define what a yield curve is, why it is so important, and why another U.S. recession may be rapidly approaching.

Let’s start with a really basic definition of a yield curve.  This one comes from Investopedia
A yield curve is a line that plots the interest rates, at a set point in time, of bonds having equal credit quality but differing maturity dates. The most frequently reported yield curve compares the three-month, two-year, five-year and 30-year U.S. Treasury debt. This yield curve is used as a benchmark for other debt in the market, such as mortgage rates or bank lending rates, and it is also used to predict changes in economic output and growth.
But most of the time, the experts that are talking about “the yield curve” are talking about the difference between interest rates on two-year and ten-year U.S. Treasury bonds.  The following comes from CNBC
Start with a government issued two-year Treasury bond and a 10-year Treasury bond. They both pay interest. Typically, the 10-year pays a higher interest rate than the two-year to compensate buyers for the time difference. The difference between the interest rates in these two bonds is called the “spread”. If the spread is greater than zero, it means the two-year interest rate is lower than the 10-year, and that is normally the case.
A normal spread for these two bonds will take the appearance of a rising chart — an upward sloping yield curve. But when the spread goes negative, the yield curve “inverts” giving the appearance of a negative yield curve.
An “inverted yield curve” strikes fear among investors because it makes lending unprofitable.
As a USA Today article recently explained, our banks borrow at short-term rates and lend that money out at long-term rates…
Banks borrow at short-term rates, lend long term and profit from the difference. So the gap between long and short rates predicts future loan profitability. The bigger the gap, the more eager banks are to lend. The yield curve is a great predictive proxy for future lending.
Lending matters because loans allow for economically expansive activities. Sally deposits $10,000 at Community Banks-R-Us, which can keep $1,000 in reserve and lend out $9,000 to Jim’s Widgets. Jim uses that to grow his business. Hence lending can fuel growth. So, steeper yield curves spur economic activity. Flatter curves render less.
Our economy is fueled by debt, and an inverted yield curve tends to greatly discourage lending.  When banks cut back on lending, that has the effect of “choking off” the economy, and that usually leads to an economic contraction…
In this interest-rate environment, banks would lose money by making loans. Not necessarily on all loans, but it does make some loans unfeasible and some less profitable, forcing banks to cut back on making loans; thereby choking off the access to credit markets that businesses need to grow. When it becomes harder for businesses to borrow, many businesses cancel or delay projects and hiring. Weaker businesses go out of business because they lose access to credit, which in turn causes layoffs. When this happens, it takes about a year, on average, for the U.S. economy to slip into a recession.
The yield curve inverted prior to the recession of 2008, and lending started to get a lot tighter.  The resulting recession was a surprise to many Americans, but it should not have been.  It was simply the logical conclusion of basic economic forces at work.
In fact, an inverted yield curve has preceded every single recession since the 1960s, but Federal Reserve Chair Jerome Powell doesn’t seem concerned that it is about to happen again…
Asked whether “a dramatic change in the shape of the yield curve in any way influence the trajectory you guys are on with respect to normalizing interest rates and the balance sheet,” Powell stated “no,” adding that “what really matters is what the neutral rate of interest is.
That’s the interest rate level that neither stimulates growth or slows it down — something that changes over time and which Fed officials try hard to gauge.
Interestingly, yield curves are about to “invert” in Japan, Germany and China too.
But it should be noted that there are some experts that insist that we are focusing on the wrong things.  One of those experts is Ken Fisher
Almost everyone everywhere misses that the total global yield curve matters much more than America’s. And it’s doing just fine, thank you. Today’s global financial system is super interconnected. Behemoth banks can borrow in low-rate countries such as Germany, transfer funds here, hedge for currency risk and lend to Jim’s Widgets in mere seconds.
The global yield curve combines every developed country’s curve, weighted by the size of each economy. You get Britain’s 0.88 percent 10-year/three-month spread, Canada’s 0.69 percent gap, Germany’s 0.92 percent, France’s 1.23 percent, Japan’s 0.18 percent and the rest. Mash them all together based on GDP weighting, and that gets you a 0.9 percent global spread that’s bouncing along, going nowhere fast. Current U.S. yield curve fears miss this.
In the end, Fisher may be right.
Without a doubt, the global financial system is more interconnected today than ever before, and we may find a way to muddle through even if the yield curve inverts in the United States.
But I wouldn’t count on it.  An inverted yield curve has accurately predicted a recession every single time since the 1960s, and it is not likely to be wrong this time around either.

Fonte: qui
Michael Snyder is a nationally syndicated writer, media personality and political activist. He is publisher of The Most Important News and the author of four books including The Beginning Of The End and Living A Life That Really Matters.

sabato 21 luglio 2018

Calm Before The Storm? Treasury 'Risk' Hits 45-Year Low As Shorts Hit Record Highs

Having killed the Japanese bond market, some are wondering if central bank interference has finally slayed the US Treasury market, as its numbness to news suggests a zombie-market-walking.
The 10-year Treasury yield has moved less than 9 basis points so far in July. After retreating from its May 17th high of 3.1261%, the benchmark yield has hovered between 2.8053% and 2.8950% in July...
Putting it on course for its smallest monthly range since 1973....
In price-terms, the realized volatility of 10Y US Treasury Futures prices for the last 30 days is the lowest since 1998!
As Bloomberg notes, Ian Lyngen, a strategist at BMO Capital Markets, said in a note this week that he’s fascinated with how unresponsive the yield has been to new information and “our sense is that something dramatic is nearing on the horizon.
And given the fact that there has never been a bigger speculative short position across the Treasury complex...
We suspect the max-pain trade would be a yield collapse.
We wonder if the catalyst will somehow be China?
Fonte: qui

domenica 17 giugno 2018

"The Global Bond Curve Just Inverted": Why JPM Thinks A Market Crash May Be Imminent

At the beginning of April, JPMorgan's Nikolaos Panigirtzoglou pointed out something unexpected: in a time when everyone was stressing out over the upcoming inversion in the Treasury yield curve, the JPM analyst showed that the forward curve for the 1-month US OIS rate, a proxy for the Fed policy ratehad already inverted after the two-year forward point. In other words, while cash instruments had yet to officially invert, the market had already priced this move in.
One way of visualizing this inversion was by charting the front end between the 2-year and 3-year forward points of the 1-month OIS. Here, as JPM showed two months ago, a curve inversion had arisen for the first time during the first week of January, but it only lasted for two days at the time and the curve re-steepened significantly in the beginning of April.
Fast forward to today when in a follow up note, Panigirtzoglou highlights that this inversion has gotten worse over the past week following Wednesday's hawkish FOMC meeting. As shown in the chart below which updates the 1-month OIS rate, the difference between the 3-year and the 2-year forward points has worsened, falling to a new low for the year of -5bp.

But in an unexpected development - because as a reminder we already knew that the market had priced in an inversion in the short-end of the curve - something remarkable happened last week: the entire global bond curve just inverted for the first time since just before the financial crisis erupted.
As JPM notes, while the Fed's hawkish move was sufficient to invert the short end further, it was not the only central bank inducing flattening this past week: the ECB also pressed lower on the curve via its "dovish QE end" policy meeting this week. And as a result of this week’s broad-based flattening, the yield curve inversion has spilled over to the long end of the global government bond yield curve also.
In particular, the yield spread between the 7-10 year minus the 1-3 year maturity buckets of our global government bond index (JPM GBI Broad bond index) shifted to negative territory this week for the first time since 2007. This can be seen in Figure 2.
But how is it possible that the global government bond yield curve can be inverted when most developed 2s10s cash curves are still at least a little steep? After all, as seen below, After all, the flattest 2s10s government yield curve is in Japan at +17bp and although the 2s10s US government curve - shown below - has been collapsing, it is still 35bp away from inversion.
The answer is in the unequal weighing of US duration in the JPM global bond index: specifically, as Panigirtzoglou explains, the US has a much higher weight in the 1-3 year bucket, around 50%, than in the 7-10 year bucket, where it has a weight of only 25%.
This is because in terms of the relative stocks of government bonds globally, there are a lot more short-dated US government bonds relative to longer-dated ones as the US has lagged other countries in terms of the duration expansion trend that took place over the past ten years.
This is shown in Figure 3 which shows the average duration of various countries’ government bond indices over time. It is very clear that the US has failed to follow other countries in the past decade’s duration expansion race and as a result there are currently a lot more non-US government bonds in longer-dated buckets which are typically lower yielding than the US. And a lot more US government bonds in short-dated buckets which are typically higher yielding.
What are the practical implications? Well, in a word, global investors - those for whom Treasury flows are fungible and have exposure to the entire world's "safe securities" - now find themselves in inversion.
In other words, with the Fed having pushed the yield on short dated 1-3 year US government bonds to above 2.5%, global bond investors who, by construction, hold more US government bonds in the 1-3 year bucket and more non-US government bonds in the longer-dated buckets, finds themselves with a situation where extending maturities at a global level provides no extra yield compensation.
And the punchline:
This means that while at the local level bond investors are still demanding a premium for longer-dated bonds, at an aggregate level – abstracting from segmentation and currency hedging issues – bond investors globally are no longer demanding such a premium.
Needless to say, although JPM says it anyway, "this is rather unusual as can be seen in Figure 2."
As for the timing, well it's troubling to say the least: it did so just before the last two bubbles burst. In fact, the last time the 7-10y minus 1-3y yield spread of JPM's GBI Broad bond index turned negative was in 2007 ahead of an equity correction and recession at the time. Before then it had turned very negative in late 1990s also, after the 1997/1998 EM crisis but also in 1999 ahead of a burst in the equity bubble and a reversal of Fed policy.
And if that wasn't enough, here are some especially ominous parting thoughts from the JPM strategist:
In other words, in normal times, bond investors demand a premium to hold longer-dated bonds and to tie their  money for a long period of time vs. investing in lower risk short-dated bonds. But when investors have little confidence in the trajectory of the economy or they think monetary policy tightening is overdone or they see a high risk of a correction in risky markets such as equities, they may prefer to buy longer-dated government bonds as a hedge even though they receive a lower yield than short-dated bonds. This is perhaps why empirical literature found that the slope of the yield curve is such a good predictor of economic slowdowns and/or equity market corrections.
In other words, contrary to all those awed but naive interpretations of the short-term market reaction invoked by Powell or Draghi, according to the market, not only the Fed but the ECB engaged in consecutive policy mistakes. And, as JPM confirms, "this week’s central bank meetings exacerbated this flattening trend."
As a result the yield curve inversion is no longer confined to the front-end of the US curve, but has also emerged at the longer end of the global government bond yield curve.
What this means is that a decade after the last such inversion, bond investors globally no longer require extra premium for holding longer-dated bonds vs short-dated bonds, something that happens rarely, e.g. when investors have little confidence in the trajectory of the economy, or they think monetary policy tightening is overdone or they see a high risk of a correction in risky markets such as equities.
Fonte: qui