9 dicembre forconi: Great Depression
Visualizzazione post con etichetta Great Depression. Mostra tutti i post

giovedì 12 luglio 2018

The Root Of The Crisis: Every $1 Of Debt Generates Just 44c Of Economic Output

Exactly ten years ago, in the middle of the summer of 2008, the world was only two months away from the most severe financial crisis since the Great Depression.
At the time, the size of the US economy as measured by Gross Domestic product was around $14.8 trillion– by far the largest in the world.
And the US national debt back then was about 64% of GDP– roughly $9.5 trillion.
Fast forward a decade and take a snapshot of the same numbers:
  • US GDP has grown nearly 35% to $19.9 trillion.
  • But the national debt has soared 122% to over $21 trillion.
The debt-to-GDP ratio in the United States is now 106%, meaning that the national debt is larger than the size of the entire US economy. Yet the debt keeps growing. Rapidly.
Now, debt isn’t really the problem here.
The problem is the way that it’s been used.
Debt (affectionately referred to as ‘other people’s money’) can actually be a great way to enhance investment returns when used wisely and judiciously.
Private equity fund managers use debt to acquire businesses through what’s known as a ‘leveraged buy-out’, where they’ll put up a portion of the cash they need, and borrow the rest.
I did this a couple of years ago, for example, when I purchased an Australian-based business for $6 million.
A local bank offered to finance most of the acquisition with a $4.5 million loan at around 5.75%.
That meant I only needed to write a $1.5 million check for a business that was earning nearly $2 million annually.
It was a no-brainer, because I knew there would be more than enough money to make the loan payment (less than $500k annually) and still generate a substantial return on investment.
Real estate investors do the same when they purchase property.
If you have, say, $1 million, you could pay cash for a single property that costs $1 million… or you could use that money as a down payment and buy a $5 to $10 million property.
If the investment is a good one, the cash flow will more than cover the loan payments, and you’ll end up making a lot more money.
Intelligent governments (hopefully not an oxymoron) will do the same thing, borrowing money to finance infrastructure projects that generate more growth and tax revenue.
Several years ago in Panama, for example, the government borrowed billions of dollars to finance the expansion of the Panama Canal.
That’s a lot of debt to take on for such a small country. But they knew that expanding the canal would dramatically increase the revenue that it generates.
The canal was originally opened in 1914 back when cargo ships were much, much smaller.
But by the early 21st century, the US Army Corps of Engineers (which built the Panama Canal in the early 1900s) estimated that the number of cargo ships which could no longer fit in the canal’s locks accounted for 45% of global trade and shipments.
So increasing the size of the canal to accommodate those larger ships (and hence generate more revenue from the increased tolls) was a great investment… and one where debt made a lot of sense.
So Panama borrowed about $3 billion to finance the canal expansion in 2008; at the time the country’s GDP was about $23 billion.
A decade later, the Canal expansion is complete, and Panama’s economy has nearly tripled to $62 billion.
It was clearly a good investment: they borrowed $3 billion in debt and got WAY more than $3 billion in additional economic output.
Now let’s go back to the US.
In the same period, from 2008 through 2018, the US government borrowed an additional $11.6 trillion on top of the existing debt they had already borrowed.
So you’d think that there would have been AT LEAST $11.6 trillion in additional economic output, right?
But that’s not what happened in the Land of the Free.
Uncle Sam borrowed $11.6 trillion between 2008 and 2018. But the US economy only grew by $5.1 trillion.
So every $1 the government borrowed resulted in just 44 cents of economic output.
Again, you’d think that every $1 borrowed would have generated at least $1 in economic output.
After all, if you borrow $10 million to acquire real estate, you’d think you’d AT LEAST have an asset worth $10 million. And if it’s a good investment, hopefully more than that.
The US government used to make good investments.
In 1803, the administration of Thomas Jefferson acquired 2.1 million square kilometers of land from the French in what became known as the Louisiana Purchase.
Jefferson’s people negotiated a hell of a deal, paying the equivalent of about $300 million– just 40 cents per acre in today’s money. And yes, they used debt to finance the purchase.
Later administrations bought Florida from the Spanish, Alaska from the Russians, the Virgin Islands from Denmark, etc. These were all phenomenal deals.
Even as late as the 1950s, the bulk of the US federal budget was productivity-related investments like infrastructure. Mandatory entitlements comprised just 29% of the budget.
(Bear in mind, back then they still had plenty of entitlement programs including Social Security, the GI Bill, etc.)
By the early 21st century there were hardly any productivity-related investments remaining.
Mandatory entitlements alone account for more than 60% of the US federal budget.
And Uncle Sam managed to blow $2 billion on a website– literally six times more than the entire Louisiana Purchase cost in inflation-adjusted dollars.
With decisions like that, it’s easy to understand how $11.6 trillion in debt would only result in $5.1 trillion in economic output.
And that’s the real killer.
It’s not the debt itself. It’s the painfully wasteful decisions of what they choose to do with it.

domenica 12 novembre 2017

Prepare For Interest Rate Rises And Global Debt Bubble Collapse

- Diversify, rebalance investments and prepare for interest rate rises
- UK launches inquiry into household finances as £200bn debt pile looms
- Centuries of data forewarn of rapid reversal from ultra low interest rates
- 700-year average real interest rate is 4.78% (must see chart)
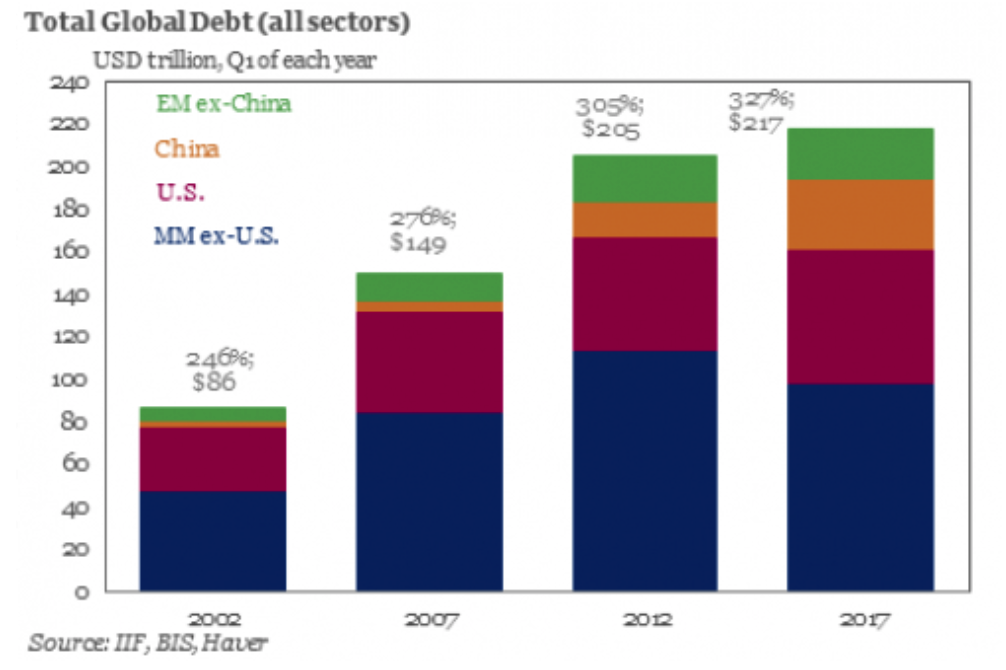
- Massive global debt bubble - over $217 trillion (see table)
- Global debt levels are building up to a gigantic tidal wave
- Move to safe haven higher ground from coming tidal wave

Editor: Mark O'Byrne
Source: Bloomberg

Last week, the Bank of England opted to increase interest rates for the first time in a decade. Since then alerts have been coming thick and fast for Britons warning them to prepare for some tough financial times ahead.
The UK government has launched an inquiry into household debt levels amid concerns of the impact of the Bank of England's decision to raise rates. The tiny 0.25% rise means households on variable interest rate mortgages are expected to face about £1.8bn in additional interest payments whilst £465m more will be owed on the likes of credit cards, car loans and overdrafts.
The 0.25% rise is arguably not much given it comes against backdrop of record low rates and will have virtually no impact on any other rate. However it comes at a time of high domestic debt levels, no real wage growth and a global debt level of over $217 trillion.
Combined with low productivity across the developed world, experts are beginning to wonder how the financial system (and the individuals within) will cope.
After a decade of seeing negative real rates of interest many investors will be quietly celebrating that they may be about to see a turnaround for their savings. Many hope they will start being rewarded for their financial prudence as opposed to the punishing saving conditions of the last decade.
In reality this will not be the case, at least for some time. Savers and investors alike need to begin to prepare their portfolios for interest rate rises against a backdrop of crisis-triggering debt levels and unproductive economies.
Economies are junkies addicted to credit
Unsurprisingly, credit levels are equal to the increase in private debt every year. Credit is when people spend money that isn't their own but instead borrow from banks. The bigger private debt levels are compared to a country’s GDP, the more the economy is dependent on credit.
Economic growth becomes addicted to credit. Therefore, the bigger the accumulated debt is when compared to GDP, the more likely it is an economic crisis will happen when credit levels are reduced.
An increase in interest rates means a decrease in credit levels. Especially in countries such as the US and UK where there has been no increase in real wage rates and there is a generation unprepared for an increase in the price of debt.
Consider the UK. When Mark Carney announced a decade-first increase in interest rates it was by a meagre  0.25%. Panic hit the newspapers; how would people with variable mortgages manage?
No one thought to ask, what are people who cannot manage a tiny increase in the cost of debt doing being allowed to borrow in the first place?
Currently debt-to-GDP ratios in the UK are not quite at pre-crisis or Great Depression levels. However they are fast approaching and they are at those levels globally. This combined with rising levels of interest rates makes for a tricky future and one that places savers and investors capital at risk.
700 year data forewarns of sudden interest rate turnaround
According to Bank of England guest blogger Paul Schmelzing as reported by Bloomberg the 700-year average real rate (the benchmark interest rates minus inflation) over the last 700 years (see chart at top) has been 4.78% and the average for the last two hundred years is 2.6%. Unsurprisingly he notes “the current environment remains severely depressed”.
More worryingly Schmelzing believes we have been in a downward trend for the last 500-years.
Upon closer inspection, it can be shown that trend real rates have been following a downward path for close to five hundred years, on a variety of measures. The development since the 1980s does not constitute a fundamental break with these tendencies.
Why is this worrying? Because the bounce back is not only inevitable, but will also be painful and sharp:
Most reversals to “real rate stagnation” periods have been rapid, non-linear, and took place on average after 26 years. Within 24-months after hitting their troughs in the rate depression cycle, rates gained on average 315 basis points, with two reversals showing real rate appreciations of more than 600 basis points within 2 years.
How will we know if such a correction is headed our way? Aside from the fact that central banks are beginning to increase rates of their own volition there are other macro indicators, many of which resonate with the current environment:
Most of the eight previous cyclical “real rate depressions” were eventually disrupted by geopolitical events or catastrophes, with several – such as the Black Death, the Thirty Years War, or World War Two – combining both demographic, and geopolitical inflections...the infamous “Panic of 1873” heralded the advent of two decades of low productivity growth, deflationary price dynamics, and a rise in global populism and protectionism.
Sound familiar?
$217 trillion global debt bubble set to pop
Currently the total global debt bubble is over $217 trillion, with little sign of it slowing. We have built a so-called economic recovery on debt. Spending has been encouraged on a pile of low interest rates and easy-to-reach cheap lines of credit. It has not been encouraged with the thought that one day interest rates will have to climb.
A sudden uptick in interest rates could not come at a more precarious time for global finances. It is not just personal debt levels that are of concern, especially when the Bank of International Settlements is aware of $13 trillion of 'missing debt'.

In September this year the BIS  said it was hard to assess the risk this “missing” debt poses, but its main worry was a repeat of events in the financial crisis: a liquidity crunch like the one that seized FX swap and forwards markets.
It is safe to say that a decade on from the global financial crisis we now have the makings of a new one.
Global debt woes are building up to a tidal wave
In November last year, unsecured household debt in the UK passed pre-financial crisis highs in 2008. In the UK, debt excluding student loans crept up to £192bn, the highest figure since December 2008, and it continues to rise this year. Meanwhile, in the eurozone, debt-to-GDP ratios in Greece, Italy, Portugal and Belgium remain over 100 per cent. As of March there were more than $10tn negative yielding bonds in Europe and Japan.
With or without moderate interest rate increases, debt on a global level is becoming more expensive as markets price in further rate hikes. Add to this the global imbalances we see across the globe it is becoming increasingly questionable how so many countries will manage to service these debts.
Clouded judgement of central bankers
When the Bank of England's Mark Carney issued a statement following the 0.25% increase, he was clearly down about the future prospects for the UK. He was so wary about encouraging any kind of positivity regarding Brexit and the country's productivity that he almost warned against sharp future rate rises. The pound dropped unexpectedly in the wake his candidness.
What's worrying to investors is that Carney (and other fellow bankers) seem to feel interest rate rises are almost to be done at whim. In truth, they are unlikely to have much more time before they are forced to hike rates and then it will be far more dramatic than a gesture of 0.25%.
This is worrying because the economy is unlikely to be strong enough to handle such a change. In turn this will impact economies, financial markets and assets - especially risk assets.
Many economists argue that it is only growth that can pull us out of this situation but we now live in a world where we only know how to create growth from debt. We do not know how to grow a healthy economy without the dripping syringe of the current debt based banking and monetary system.
This is the case both in people's homes and in the highest government offices. It is an epidemic of global proportions.
Investors need to protect themselves from the addictive nature of these behaviours. We all know what happens to those who are unable to cut themselves off. They find excuses and then they come knocking for help. This is where you must ensure your finances are protected. and you are not forced to "help" the reckless bankers and their dangerous monetary system.
Move to safe haven higher ground from coming debt tidal wave
As we have discussed previously, the global debt bubble is prompting the wealthiest to diversify into gold. Wealthy investors and some of the world's largest institutions in the world, including Lord RothchildsRay Dalio and insurance company Munich Re, have all expressed their desire to protect their portfolios from the next financial crisis.
The next financial crisis may well be preceded by something we did not experience ten years ago but is now a very real scenario - bail-ins. As banks struggle to retrieve payments from those unable to service debts they will begin to falter. Governments will need to step-in. 'Luckily' for them they had the foresight to agree that bail-ins could happen.
This places your investments and especially your deposits at arguably greater risk than before the first financial crisis. With this in mind, follow the likes of Munich Re and prepare your portfolio against counterparty risk, unforeseen consequences of interest rate climbs and the collapse of the global debt bubble. Avoid ETF and digital gold and dependence on single counter parties and have outright legal ownership of segregated, allocated gold bullion coins and bars.
Related Content

News and Commentary

Source: Bloomberg

Gold Prices (LBMA AM)
09 Nov: USD 1,284.00, GBP 980.98 & EUR 1,106.29 per ounce
08 Nov: USD 1,282.25, GBP 976.82 & EUR 1,105.43 per ounce
07 Nov: USD 1,276.35, GBP 970.92 & EUR 1,103.28 per ounce
06 Nov: USD 1,271.60, GBP 969.72 & EUR 1,095.61 per ounce
03 Nov: USD 1,275.30, GBP 976.24 & EUR 1,094.59 per ounce
02 Nov: USD 1,276.40, GBP 965.09 & EUR 1,095.92 per ounce
01 Nov: USD 1,279.25, GBP 961.48 & EUR 1,099.52 per ounce

Silver Prices (LBMA)
09 Nov: USD 17.10, GBP 13.03 & EUR 14.69 per ounce
08 Nov: USD 17.00, GBP 12.96 & EUR 14.65 per ounce
07 Nov: USD 17.01, GBP 12.95 & EUR 14.70 per ounce
06 Nov: USD 16.92, GBP 12.90 & EUR 14.59 per ounce
03 Nov: USD 17.09, GBP 13.05 & EUR 14.67 per ounce
02 Nov: USD 17.08, GBP 12.98 & EUR 14.66 per ounce
01 Nov: USD 16.94, GBP 12.74 & EUR 14.55 per ounce


Recent Market Updates


Important Guides
For your perusal, below are our most popular guides in 2017:
Please share our research with family, friends and colleagues who you think would benefit from being informed by it.
Fonte: Z.H.