The gold market is heading towards a big fundamental change that few are prepared. While many analysts in the alternative media community suggest that the gold price is manipulated due to Fed and Central bank intervention, there is another more obscure rationale that is the likely culprit. I call it, "The Blind Conspiracy."
But, before I get into the details of this Blind Conspiracy, there are a few very troubling developments in the alternative media community that I would like to discuss first. The bulk of these concerns has to do with the increasing amount of faulty analysis and misinformation as well as the peddling of lousy conspiracy theories on the internet.
Why is this a big problem? Because a lot of readers are being misguided as to the true nature of the serious predicament we are facing. Half of the emails that I receive are from readers who are bringing up doubts based on other analysts' faulty analysis and misinformation. Thus, it takes a great deal of effort to provide the real facts and data to counteract the damage being done by certain individuals, even those with good intentions.
Furthermore, an increasing number of so-called precious metals analysts have switched over to Bitcoin and other cryptocurrencies, believing that gold and silver will no longer function as monetary metals. However, some of these analysts suggest that silver will still be valuable because it will be used as critical raw material in advanced products in our new HIGH-TECH WORLD. I find this idea of a future modern high-tech world quite amusing when we can't even maintain the failing complex infrastructure we are currently using.
American Society Of Civil Engineers 2017: U.S. Infrastructure Grade Is...???
According to the Amercian Society Of Civil Engineers, ASCE, they just came out with their grade this year for U.S. infrastructure. Does anyone want to guess what overall grade we received here in the good ole U.S. of A? The ASCE gave us a D+:

Well, at least a D+ isn't an "F" grade. Here is the ASCE's Infrastructure Report Card Grading Scale for receiving a "D":
"D" GRADE = POOR, AT RISK
The infrastructure is in poor to fair condition and mostly below standard, with many elements approaching the end of their service life. A large portion of the system exhibits significant deterioration. Condition and capacity are of serious concern with strong risk of failure.
The ASCE U.S. Infrastructure Report also provides separate grades for different aspects of U.S. infrastructure. For example, the U.S. Energy Infrastructure received a "D+" as well. This is a brief description of the Energy Infrastructure:
Much of the U.S. energy system predates the turn of the 21st century. Most electric transmission and distribution lines were constructed in the 1950s and 1960s with a 50-year life expectancy, and the more than 640,000 miles of high-voltage transmission lines in the lower 48 states’ power grids are at full capacity.
Moreover, the report states that $4.5 trillion needs to be invested 2016-2025 to raise the U.S. infrastructure to a "B' Grade. However, only $2.5 trillion has been budgeted. Thus, we are $2 trillion short of the total amount needed. Regardless, I doubt we will be able to spend anywhere close to the budgeted $2.5 trillion over the next decade for our infrastructure. Unfortunately, I see the U.S. Government and private sector running into serious financial trouble by 2020 as the massive amount of debt and derivatives finally take down the system.
So, the question remains. How are we going to move into a new HIGH-TECH world if we can't even maintain our current infrastructure?
The notion that we can bring on some new "Energy Technology" fails to consider the tremendous amount of raw materials, manufacturing, transportation, and logistics to repair and maintain our current infrastructure. You see, we have much bigger problems than just replacing an energy source or technology. But, to understand that principle, you must look past superficial thinking and "Silver-Bullet energy technologies."
Now, if you hear certain analysts suggesting that gold and silver will no longer be used as money in the future because cryptocurrencies will take over the monetary role in our new high-tech world, you may want to contact them and provide the link to the U.S. Infrastructure D+ Grade Report.
Destroying Once Again.... Certain Myths About The Gold Market
If I collected an ounce of gold for every email that I have received about patently false gold myths and conspiracies; I could buy one hell of a lot of silver....LOL. Gosh, if I went back to my email folder and added up all the emails on this subject, it would number well over 500 in my ten years publishing articles in the alternative media community. However, I continue to receive the same type of emails because individuals are still being misled.
Before I begin, let me say that I focus my work on disproving the faulty analysis by other individuals, and not directing anything negative towards the person. I am adamantly against the idea of "targeting the messenger." Rather, I like to target the faulty message. So, there is nothing personal in my attempt to set the record straight.
Let me start off by saying.... THERE AREN'T MILLIONS OF TONS OF HIDDEN GOLD in the world. Anyone who continues to believe this needs to pay close attention to the following information.
One of my readers sent me the following recent YouTube video by Bix Weir, titled "Vast Gold Riches Hidden In The Grand Canyon":

In the video, Bix quotes a New York Times article published on June 19, 1912, that proclaimed vast gold riches in the Grand Canyon. According to Bix, this massive gold find is what prompted the starting of the Federal Reserve because billions of ounces of new gold from the Grand Canyon dumped into the market would destroy the monetary system.
While this may sound plausible to the layman, if we carefully read the article and do some additional research, we will come to a much different conclusion than what Mr. Weir is suggesting.
First, Bix makes a grave error during the interview when he states "billions of ounces of gold," rather than "billions of Dollars of gold." Here is the segment of the article:

There's a big difference between a billion ounces of gold and a billion dollars worth of gold. For example, the market price of gold in 1912 was $20.65 an ounce. If we assume that $2 billion worth of gold was extracted from the Grand Canyon, it would equal approximately 100 million oz of gold. If we take it a step further and convert it to metric tons, it would equal 3,110 metric tons.... a figure much much lower than one million tons stated by Mr. Weir.
Second, the article provides us with an idea of the very low quality of the gold found in the silt on the banks of the Grand Canyon:

As we can see, the individual in charge of the mining operation in the Grand Canyon stated that the value of gold was worth 50 cents per yard. When gold miners refer to a "yard," they mean a cubic yard or a volume that equals 1.3 tons. With an ounce of gold worth $20 in 1912, 50 cents a yard is a tiny amount of gold. Thus, 50 cents worth of gold in a yard is approximately 0.025 oz or one-fortieth of an ounce of gold.
Let's compare the supposed vast Grand Canyon gold riches worth 50 cents a yard to the gold mining that took place in Alaska during the same period. According to the data provided by the U.S. Bureau of Mines in 1912 Report:

This chart represents "Placer" gold mining in Alaska, which was the same type of gold mining that took place on the banks of the Grand Canyon. Placer gold mining is the process of washing gold from gravel, sand or silt. Lode mining is extracting gold ores from veins in rock. Here we can see that the average value of gold recovered in Alaska in 1912 was $2.10 per cubic yard. Now, why on earth would anyone want to go to the remote location in the Grand Canyon and mine gold for 50 cents a yard when you could receive four times as much in Alaska??? Please, someone forward that information to Mr. Weir.
Third, the notion of extracting Billions of Dollars of gold from the Grand Canyon fails logistics miserably. Let's overlook Mr. Weir's error in quoting billions of ounces of gold rather than billion dollars of gold and consider the tremendous logistics of mining that amount gold out of the Grand Canyon. According to the same U.S. Bureau of Mines 1912 Report linked above, Alaska produced a total of 7.4 million oz of gold worth $154 million between 1880 and 1912:

So, in over three decades of mining placer gold in Alaska, the total amount was $154 million. Furthermore, the value of the gold per yard was likely much higher between 1880-1900. Regardless, it took a great deal of human resources, energy, and capital to produce the $154 million worth of gold and the most ever produced in one year during that time-period in Alaska, was 1,066,000 oz of gold in 1906 valued at over $22 million.
Which brings us to the next logical conclusion.... was it ever possible for anyone to produce billions of dollars worth of gold valued at 50 cents a yard in the Grand Canyon when a small percentage of that amount ($154 million) took over three decades to produce in Alaska? Hell, even during the mighty California Gold Rush of 1848, the peak year of 3.9 million ounces in 1852 was only worth $80 million. However, the average annual gold production for the California gold rush was only 1.3 million ounces per year valued at $26 million. It would take a great deal of time mining gold during the famous California Gold Rush to equal just $1 billion.
Even at $1 billion, that is only 50 million oz of gold or a measly 1,555 metric tons of gold. Again, nowhere near the one million tons of gold suggested by Mr. Weir.
Lastly, the supposed vast gold riches in the Grand Canyon came to a dismal end. That's correct. If we spent a few minutes doing a bit of research on the internet, we would find out The Rest Of The Ugly Story.

(American Placer Gold - Spencer Mining Operation 1911, Grand Canyon)
According to Arizona State history of gold mining at Lee Ferry in the Grand Canyon, the American Placer Gold company needed coal to process the gold. Unfortunately, the only coal seam was 28 miles away. So, the gold mining investors decided to incorporate a steamboat to transport the coal:

Investors decided a 92-foot steamboat would improve coal transport and gold production; it was ordered and assembled by late February 1912. Dubbed the Charles H. Spencer, the steamboat performed the way it was supposed to, but it burned most of the coal it transported in the process. Spencer also had trouble with his amalgamator and by 1912 his investors had seen enough and shut the project down. Spencer left, and his boat sank to the bottom of the Colorado River. The Charles H. Spencer is now on the National Register of Historic Places as a shipwreck in Arizona.
Just consider for a moment the type of intellectual thought process taken by these investors who couldn't understand that the steamboat would consume most of the coal during its 28-mile trip.
Thus, the LIFE & DEATH of the Great Vast Gold Riches in the Grand Canyon came to an abrupt end, not because there were billions of ounces of gold that would destroy the global monetary system, but rather due to the typical mistake made by investors. And that is... the belief that utterly incompetent management and miners could extract low-quality gold that is uneconomical to produce.
So, if we look at the New York Times article that Mr. Weir quotes as his source of billions of ounces of gold, we can logically assume that it was likely written by the company spokesman to get more POOR UNWORTHY INVESTOR SLOBS to purchase the American Placer Gold stock before it went belly-up. It's called the PUMP and DUMP.... a shady stock marketing technique that has been going on for hundreds of years.
If we can have an open mind and the ability to discern fact from fiction or lousy conspiracy theories, we can finally put an end to the notion that the world has a Million Tons of Hidden Gold in the world.
THE BLIND CONSPIRACY: The Gold Market Is Heading Towards A Big Fundamental Change
Now that we have dispensed with certain conspiracies that don't pass the smell test, there is a real one that very few are aware. I call it the BLIND CONSPIRACY. The interesting thing about this conspiracy is that nobody really knows about it. However, it behaves like a conspiracy because many individuals and parties are manipulating the market which is providing a false sense of security to the average investor.
Thus, investors with a false sense of security, continue to invest in STOCKS, BONDS, and REAL ESTATE at amazing inflated values. Today, the Dow Jones hit a new record high of 24,272 points:

If you look at this chart of the Dow Jones Index, it is starting to resemble the Bitcoin chart. However, Bitcoin's graph is moving up at a level ten times more insane than the Dow Jones Index:

While the Dow Jones Index increased 4,200 points, or 21% since the beginning of 2017, the Bitcoin price has surged more than $9,000, or a staggering 1,125% increase. Furthermore, the Bitcoin price doubled in just the past month. This is completely insane. Even though a lot of Bitcoin enthusiasts are shouting for $20,000 and $100,000 Bitcoin, if we are ever going to get there, there needs to be a serious correction first. However, we may have already seen the top of Bitcoin at $11,400.
Folks, nothing goes straight up and then continues even higher. I would be very cautious about investing in Bitcoin at this time. Both the stock market and cryptocurrencies are extremely overbought... to say the least. On the other hand, gold and silver have been selling off over the past several days and are even closer to their lows and cost of production.
Getting back to the Blind Conspiracy and the Big Fundamental Change in the gold market, investors are entirely in the dark about the dire energy predicament we are facing. I continue to receive emails from individuals in various industries that tell me the "Situation is MUCH WORSE than you realize." Also, there are good CLUES published in the media if you are IN-TUNE to this information.
According to this jewel, titled Oil Major: 70% Of Crude Can Be Left In The Ground, by Nick Cunnigham:
“A lot of fossil fuels will have to stay in the ground, coal obviously … but you will also see oil and gas being left in the ground, that is natural,” Statoil’s CEO Eldar Saetre told Reuters in an interview. “At Statoil we are not pursuing certain types of resources, we are not exploring for heavy oil or investing in oilsands.If heavy oil and oil sands are to be left unproduced, then a lot of oil will need to stay in the ground. According to the USGS, about 70 percent of the world’s discovered oil reserves are in the form of heavy oil and bitumen. Much of that comes from Venezuela – one of the last places in the world that an oil company wants to do business in these days – and Canada.Last year, Statoil abandoned Canada’s oil sands, selling off its assets to Athabasca Oil Corp. But Statoil is hardly alone in the exodus. ConocoPhillips unloaded a whopping $13.3 billion of oil sands assets to Cenovus Energy earlier this year. Shell sold off $4.1 billion in oil sands assets to Canadian Natural Resources. Meanwhile, ExxonMobil wrote off 3.5 billion barrels of oil sands from its book in February, admitting that they were unviable in today’s market.ConocoPhillips’ CEO said that it would no longer invest in any oil project that needs a breakeven price of $50 or higher, according to the FT.
If the Major Oil Industry believes that upwards of 70% of the oil reserves should be left in the ground, how much do we really have left to produce?? Furthermore, it was quite surprising to see that the ConocoPhillips CEO said they would no longer invest in oil projects with a breakeven above $50. Folks, there aren't many oil discoveries available with a price tag less than $50 a barrel.
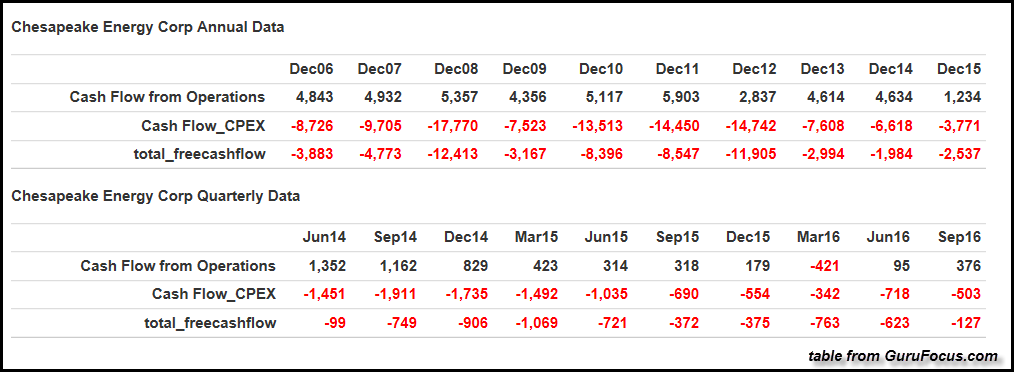
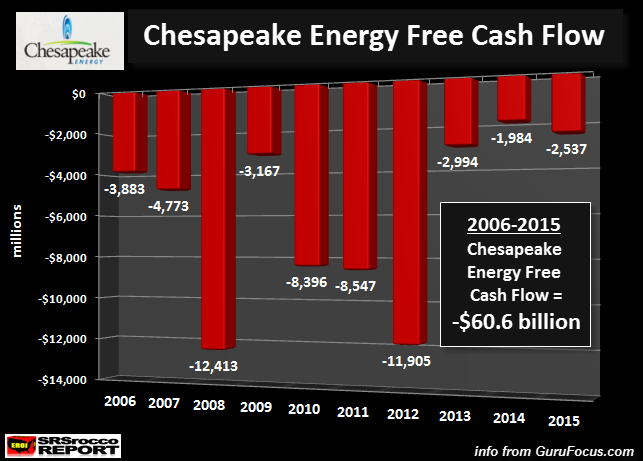
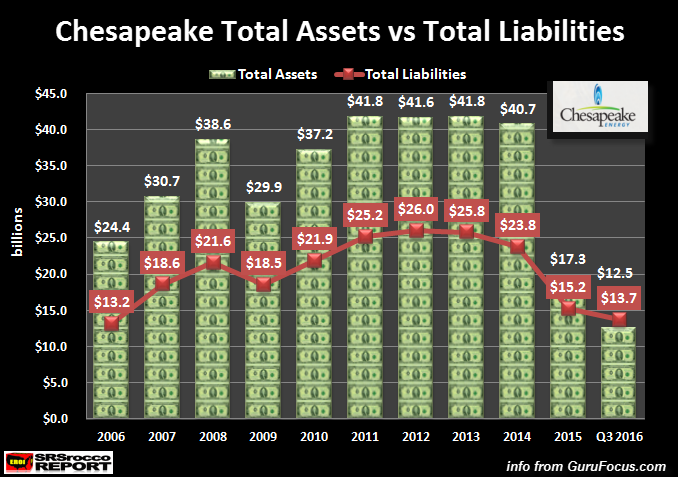
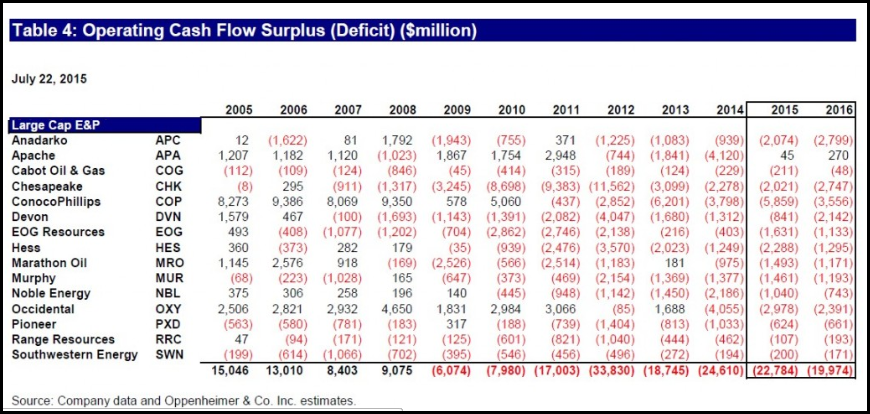
Again, the clues are all around. Let me repost the completely awful financial results by the second largest natural gas producer in the United States. Chesapeake Energy produced the second highest amount of natural gas during the first nine months of 2017 at 2.9 billion cubic feet per day compared to ExxonMobil's 3.1 billion cubic feet per day. So, what benefit did Chesapeake receive for producing the country's second largest amount of natural gas? Take a look at the Q3 2017 Cash Flow Statement:

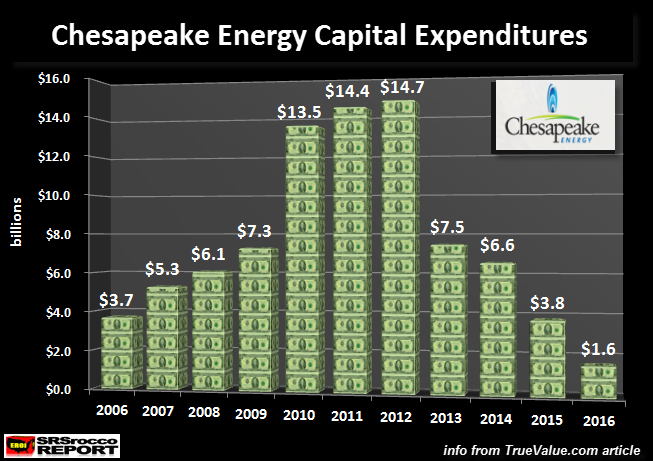
After everything was considered, Chesapeake's operations provided $273 million in cash (shown in the highlighted yellow). For those who are not familiar with Cash Flow Statements, we subtract capital expenditures from cash from operations to arrive at their FREE CASH FLOW. Unfortunately for Chesapeake, they spent a staggering $1.6 billion (highlighted in blue) on drilling and completion costs (capital) to produce their natural gas and oil. Thus, Chesapeake's Free Cash Flow was a negative $1.3 billion.
That would have been terrible news if it wasn't for the sale of properties of worth $1,193 million ($1.2 billion.. two lines below the highlighted blue line). Which means, the financial wizards at Chesapeake used asset sales to help pay for their natural gas drilling capital expenditures. How long can Chesapeake sell properties to fund their drilling costs??
Are we starting to get a PICTURE here? Regrettably, even highly trained energy analysts do not understand that the oil and gas industry is cannibalizing itself just to stay alive. If investors do not understand just how bad our energy situation has become, they are BLINDLY investing in the worst assets (STOCKS, BONDS & REAL ESTATE) that derive their value from the burning of ENERGY.
This is the BLIND CONSPIRACY. It's taking place right in front of our eyes, and virtually no one sees it.
We are going to experience a Massive Fundamental Change in the gold market because investors will finally begin to understand what a true store of wealth is versus one that is an ENERGY IOU. Stocks, Bonds, and Real Estate get their value from burning energy IN THE FUTURE, while a gold or silver coin bought today, received its value from burning energy IN THE PAST. That is a big difference that investors, even precious metals investors fail to realize.
Lastly, if you want to pay more for precious metals, than I suggest you don't check out our PRECIOUS METALS INVESTINGsection or our new LOWEST COST PRECIOUS METALS STORAGE page.
Check back for new articles and updates at the SRSrocco Report.
Fonte: qui