As we continue to kickoff the second month of trading in 2018, today the man who has become legendary for his predictions on QE and historic moves in currencies, warned King World News that we are now in the final phase of a worldwide euphoria that is about to end in catastrophe.
February 4 (King World News) – Egon von Greyerz: “Virtually no investors study history and the few who do always think it is different today. The most important lesson is that people never learn. If they did, they wouldn’t be invested in a stock market that on any criteria is now at a bubble extreme. And they wouldn’t be invested in a global debt market which has grown exponentially in recent decades and which will become worthless in the next few years as debtors default. Nor would anyone hold paper money, which is down 97-99% in the last 100 years, and which is guaranteed to soon fall the final bit to take the value to zero.
The history of money clearly illustrates that “Plus ça change, plus c’est la même chose” (the more it changes, the more it is the same thing). The most constant factor in the history of money is the cycle of boom and bust or euphoria and despair. Cycles are part of nature just like the change of seasons.
But throughout history, mankind has always believed that they know better than previous generations and can eliminate the cycle of boom and bust. This is what the British prime minister Gordon Brown proudly declared before the economy collapsed in 2007…
Sponsored
Egon von Greyerz continues: “And the Nobel Prize winner in Economics, Paul Krugman, also believes that eternal prosperity can be generated by creating endless debt and printing unlimited money.But history has time and time again turned hubristic know-it-alls into humbled has-beens.
The Consequences Have Been Catastrophic
Whenever mankind has deviated from sound money, the consequences have, without fail, been catastrophic. The only money which has survived since it first came into use around 6,000 years ago is gold. All other money has been destroyed by greed and economic mismanagement. I believe I have quoted Voltaire for over 20 years and will continue to do so:
“Paper Money Eventually Returns to its Intrinsic Value – ZERO.”
Whether we go back 100 years, 300 years or 2,000 years, those superb 9 words are the most exact and scientific definition of economic history. This is the most important lesson that any student of economics should learn. Armed with that knowledge, anyone can forecast the likely outcome of an economic cycle, especially the current one.
So why are investors not taking heed and protecting themselves against risks that on a global scale have never been greater? The first reason is greed. Whether it is stocks, tulip bulbs or bitcoins, people never learn. Greed takes over and numbs any rational thinking. And that is why most investors will ride the bubble markets until they are virtually worthless.
I Experienced The 1973, 1987, 2000 & 2007 Collapses
Experience and a long professional life are a great advantage when it comes to understanding risk. Nothing beats personally experiencing major market crashes of 50% or more in 1973, 1987, 2000 and 2007. This certainly makes you more aware of risk and therefore the necessity to preserve wealth. Looking back at the Dow since 1971, it is up 29x or 2,800 percent. So why worry because “stocks always go up?” Yes, it is absolutely true that in the last 47 odd years since Nixon took away the gold backing of the dollar, asset markets have boomed. But most of these gains have been illusory and due to credit expansion, money printing and currency debasement.
But investors are still certain that stocks will continue to grow over time. They don’t realize what will happen to their investments when the punchbowl is taken away and interest rates increase substantially, and that is what we will see in the next few years. Stocks have been going up only because of credit expansion and artificially low interest rates. These two factors are unlikely to be in play in coming years. Yes, central banks will panic and print unlimited amounts of money but the market will soon realize that this money is worthless and therefore will have no effect.
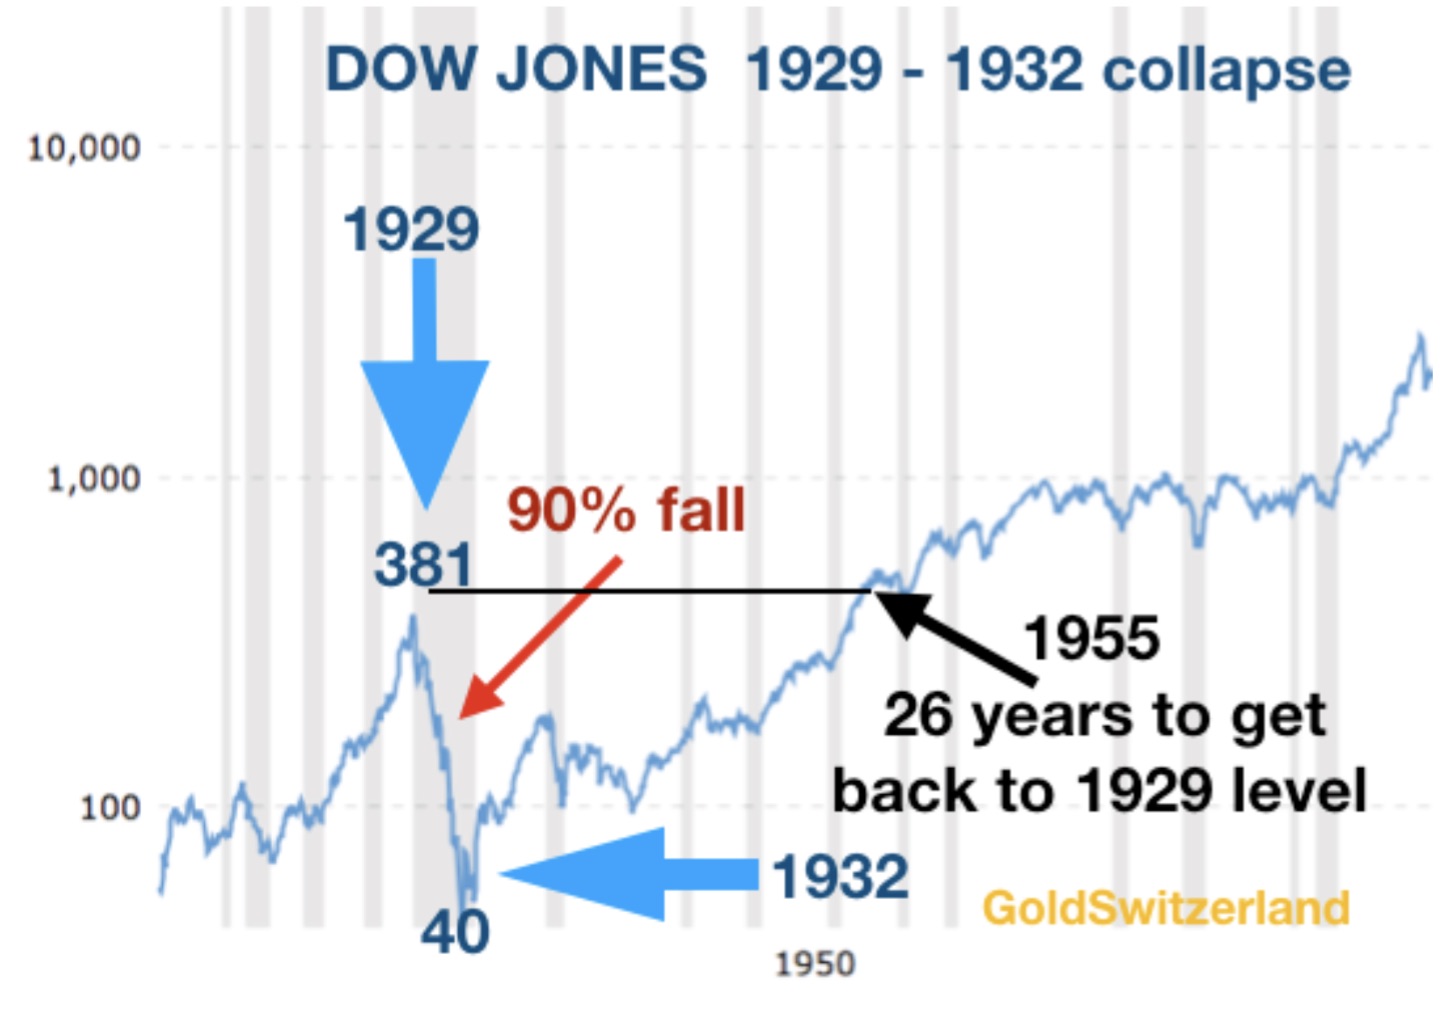
What investors don’t realize is that it can take a very long time for stocks to climb back up that high wall of worry after a big fall. In 1929 the Dow peaked at 381 and then fell 90% over less than three years to bottom at 40 in 1932. But what few investors realize is that it took 26 years before the Dow was back to the 1929 high.
The almost 700 points drop in the Dow on Friday was a foretaste of things to come. We might not see the end of the multi-decade bull market quite yet but risk is colossal today. Once the bear market starts, the Dow will experience days of several thousand point declines. The 1929 crash was 90% but since the current bubble is so much greater by any measure, the coming fall of US stock markets is likely to be at least 95%.
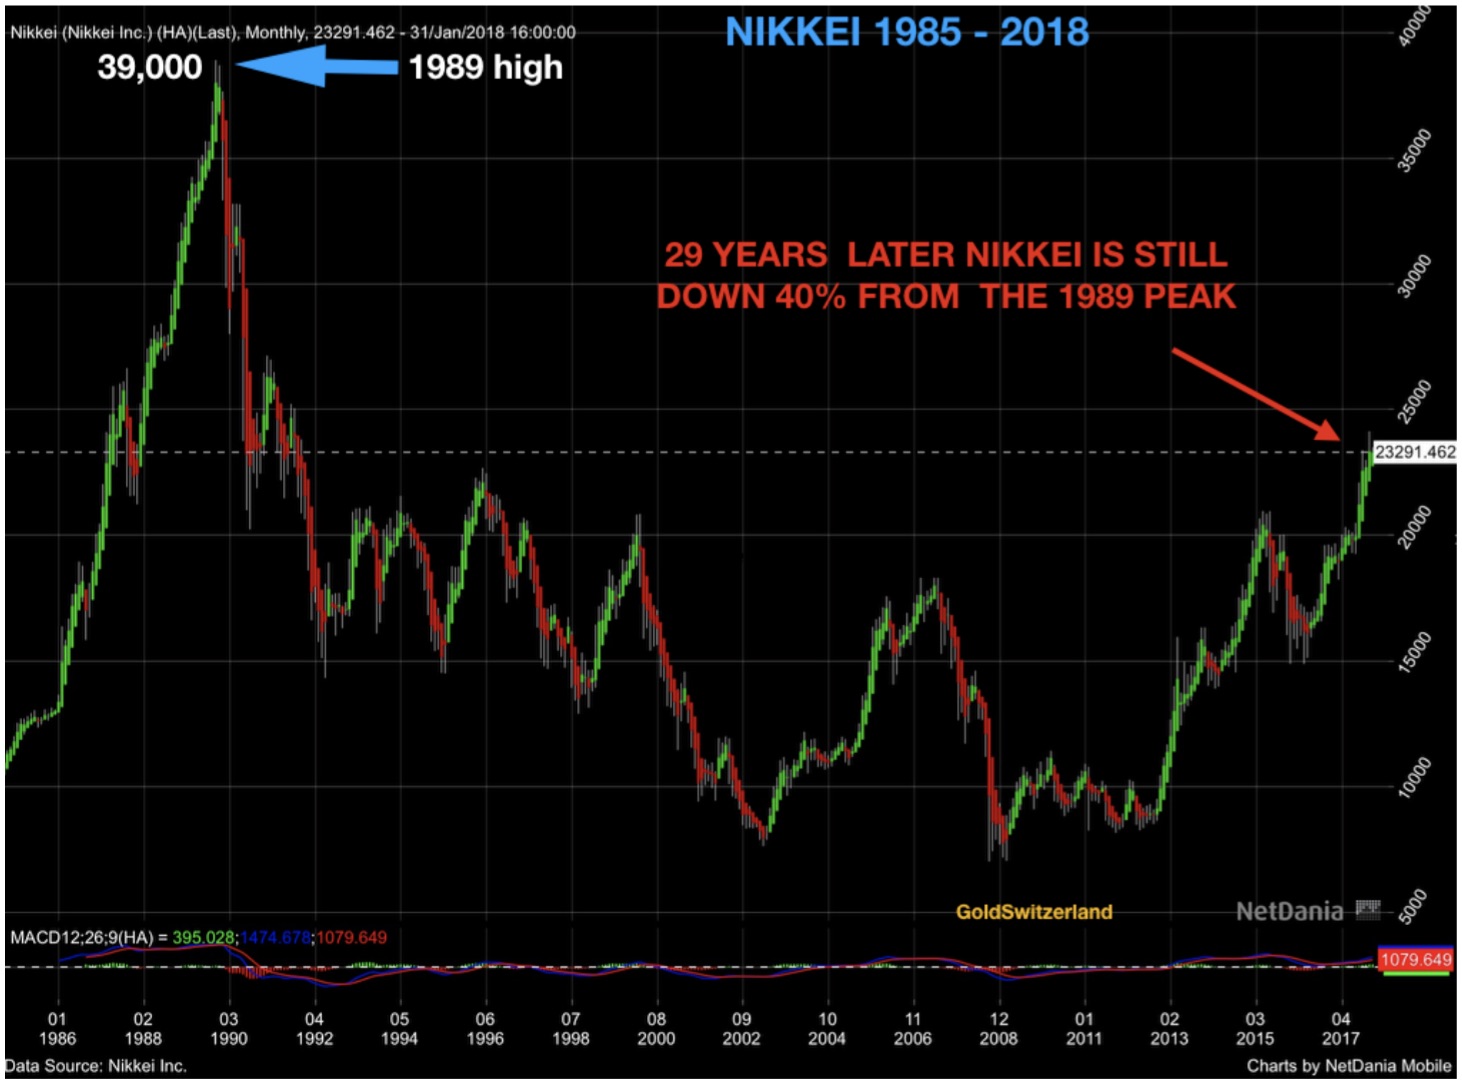
A more recent example of a stock market not recovering is the Nikkei which topped at 39,000 in 1989. Today, 29 years later, the Nikkei is still 40% below that level after having been down as much as 80% from the high. In spite of massive money printing with debt well over 1 quadrillion yen and zero or negative interest rates for most of the last 29 years, the Japanese stock market is still in the doldrums. The most likely outcome for Japan is that the economy will collapse with stocks going down 95% or more with the value of debt going to zero followed by the yen, which will also go to zero.
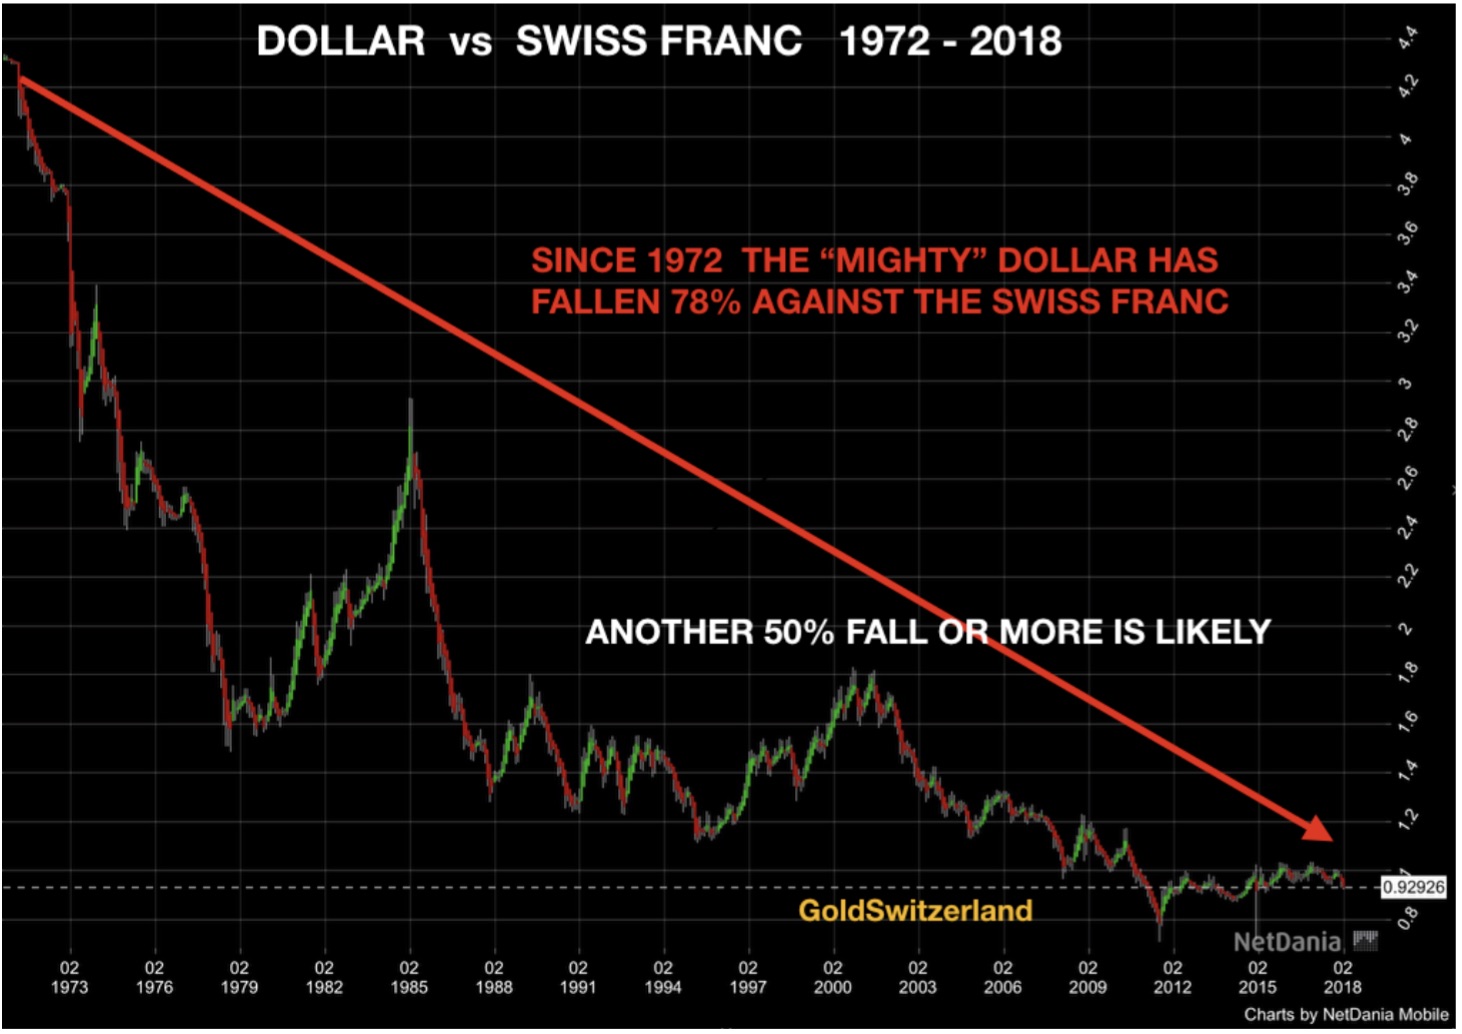
Looking at the dollar since 1971, it has lost 78% against the Swiss franc and 56% against the DMark/Euro.
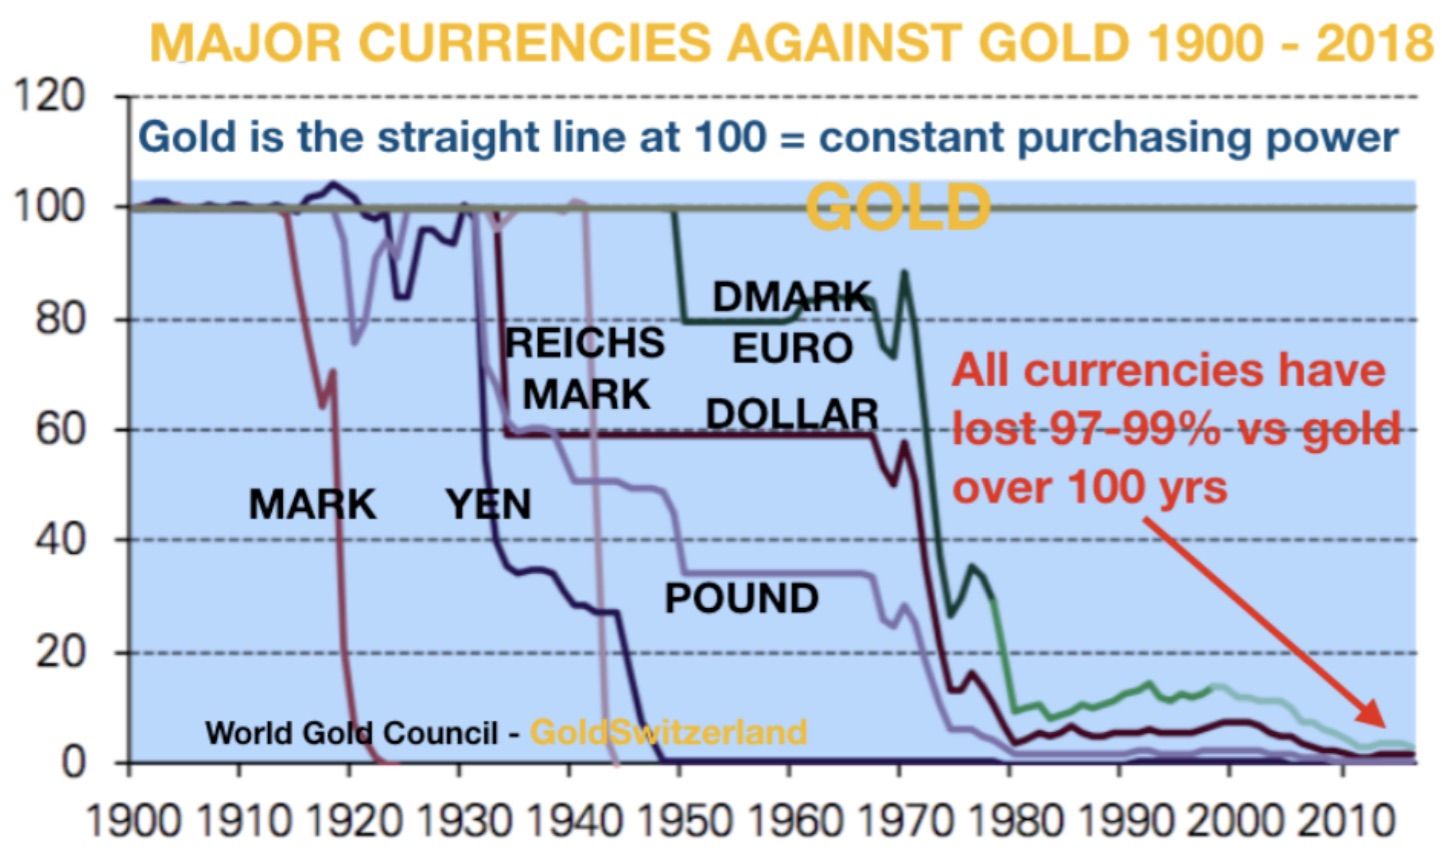
If we measure against real money – gold – the dollar has lost 98% in the lat 100 years. Most of that fall took place after Nixon’s fatal decision in 1971.
It is clear that the dollar will lose the additional 3% against gold to make it reach ZERO, its intrinsic value. But we must remember this means the dollar will fall 100% from its current level. And that fall is virtually guaranteed. It is only a question of how long it will take. The biggest part of the dollar decline could happen very rapidly, within 3 to 7 years. At the same time, US debt will go to zero and interest rates will reach infinity.
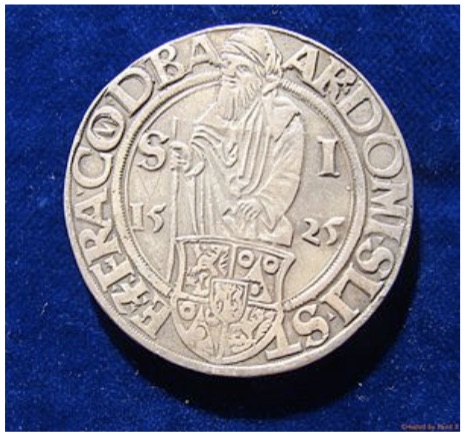
Interestingly, the word dollar came from the Czech Kingdom of Bohemia where silver coins were minted in the early 1500s. The area was called Joachimsthal (Joachim’s valley) and the money Joachimsthaler shortened to Thaler or Daler (Dollar). This word for money was used in many countries in the world. It came to America as the Spanish American Peso which became the Spanish dollar. In 1785 it was adopted in the US as the official currency – the American dollar. When the US dollar collapses in coming years, it will be interesting to see how long it will take for the dollar to totally disappear, just as the Denarius did when the Roman Empire collapsed.
The silver coin Denarius was first minted in 211 BC. As the finances fo the Roman Empire deteriorated, the Denarius was gradually debased. During the 100 year period — 180 to 280 AD — the silver content of the Denarius went from 87% to 0%. This is exactly what is happening to the currency system today with all major currencies down 97-99% measured in nature’s money – Gold. But we still have the final 1-3% to come which will be extremely painful for the world.
The Final Phase Of A Worldwide Euphoria
We are now in the final phase of manic euphoria. Within the next 6 to 18 months the euphoria will turn into dysphoria as 100 years of economic mismanagement and manipulation come to an end. It will not only severely affect financial markets and the world economy but also the fabric of society in most countries. I have talked about this many times and it certainly is a depressing scenario. The world is likely to experience very high unemployment, little or no money for most people, disease, famine, no social security, no pension, little medical care, social unrest, wars, etc.
No one, absolutely no one, can prepare fully for this or avoid it. We will all suffer. As I have stressed many times, the circle of family and friends is the best protection and more important than anything else. For the few who are privileged to have savings, it is still not too late to acquire some physical gold and silver. As the financial system crashes, precious metals will resume their role as money. Not only will gold and silver become extremely valuable and desired, but more importantly, it will maintain purchasing power as it has for 6,000 years.
That is why investors must not be influenced by short term fluctuations in the gold and silver price. Without warning gold will one day start moving up 100s of dollars and silver 10s of dollars over a very short period. Gold and silver must be acquired today at current low prices. When the real move starts, it will be impossible to get hold of physical gold and silver at any price.”